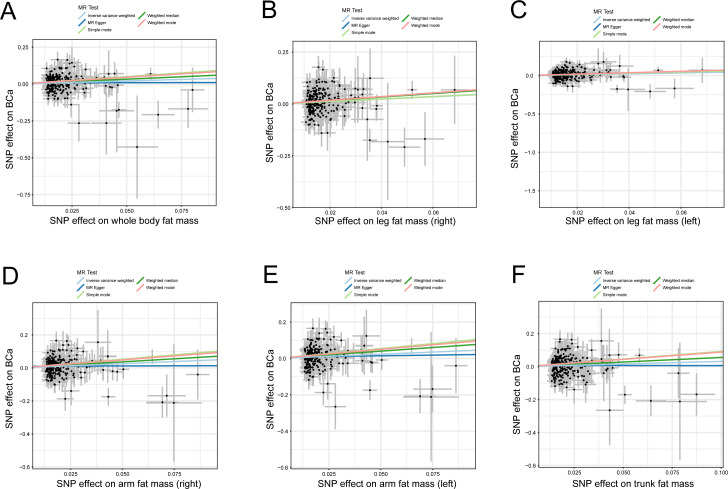
Figure 2. Scatter plots of body fat indexes with the risk of BCa.
Scatter plot demonstrating the effect of each body fat indexes-associated SNP on the risk of BCa on the log-odds scale, (A) whole body fat mass, (B) leg fat mass (right), (C) leg fat mass (left), (D) arm fat mass (right), (E) arm fat mass (left), and (F) trunk fat mass; The slopes of each line represent the causal association for each method. MR, Mendelian randomization; SNP, single-nucleotide polymorphism; BCa, bladder cancer.

