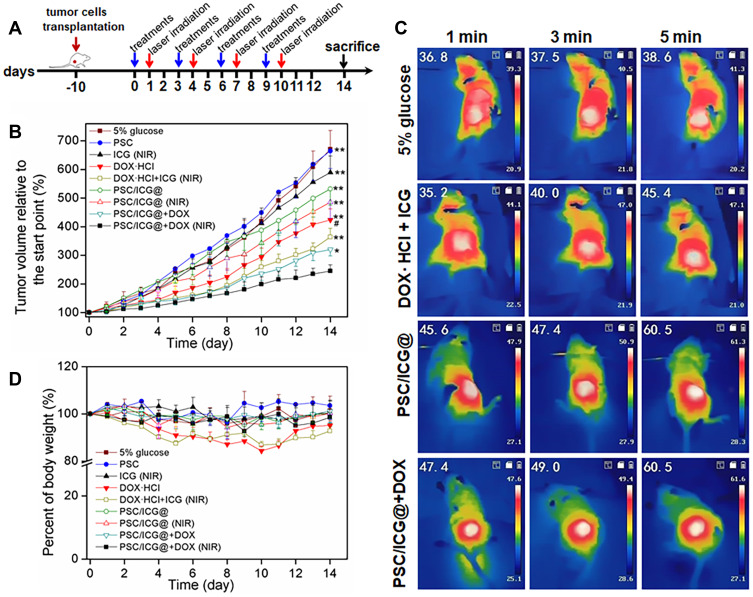
Figure 7.
(A) Scheme of the timeline for in vivo treatment and laser irradiation in 4T1-bearing orthotopic mice. (B) Tumor growth curves of mice after the treatment. (C) The images of 4T1-bearing mice with the injection of 5% glucose, DOX·HCl+ICG, PSC/ICG@ or PSC/ICG@+DOX nanoparticle after laser irradiation under the 808 nm laser irradiation (2.0 W/cm2) at 24 h post-injection. (D) Body weight change within 14 days. *P < 0.05, PSC/ICG@+DOX (NIR) group vs PSC/ICG@+DOX (no NIR) group; **P < 0.01 PSC/ICG@+DOX (NIR) group vs other groups; #P < 0.05, PSC/ICG@+DOX group (no NIR) vs DOX·HCl group. (n=5).

