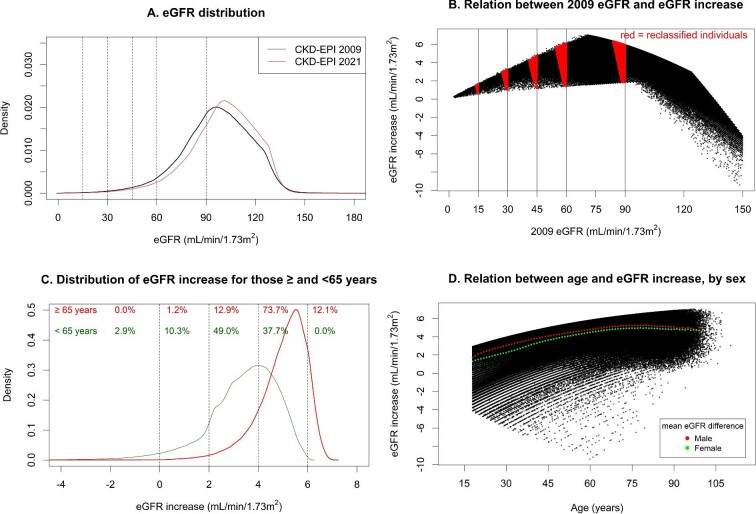
FIGURE 1:
(A) eGFR distributions for 2021 and 2009 CKD-EPI equations. (B) Relation between 2009 eGFR and increase in eGFR when changing from the 2009 to the 2021 CKD-EPI equation. (C) Distribution of eGFR increase when changing from the 2009 to the 2021 CKD-EPI equation, separately for those ≥65 and <65 years. (D) Relation between age and increase in eGFR when changing from the 2009 to the 2021 CKD-EPI equation, with mean increase shown separately for both sexes. (A) Distribution based on kernel density estimation. Dotted vertical lines depict KDIGO GFR thresholds. (B) Each black dot represents an individual. Vertical lines represent GFR thresholds. Red areas denote individuals who are reclassified to a less severe CKD G category. (C) Distribution based on kernel density estimation. Numbers depict the proportion of participants within categories of eGFR difference (<0, 0–2, 2–4, 4–6, >6 mL/min/1.73 m2), separately for those ≥65 and <65 years. (D) Each black dot represents an individual. The red and green dots show the mean difference in eGFR between the 2021 and 2009 equation for males and females, respectively, by 1-year age strata.

