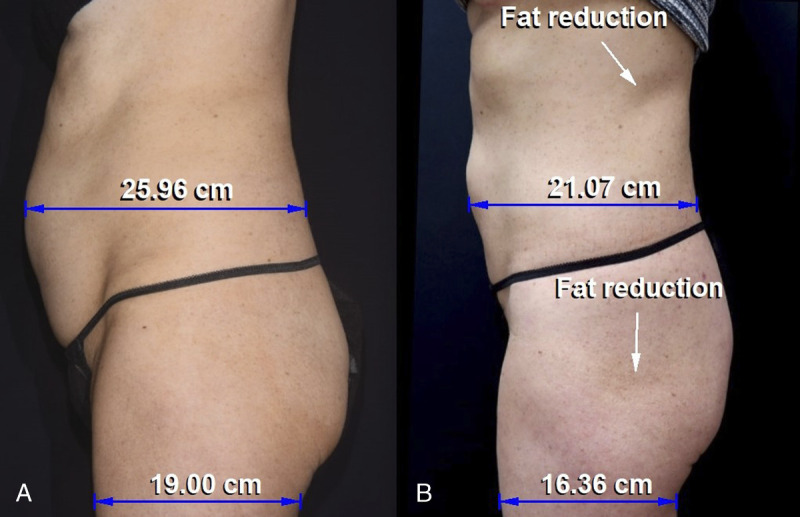
FIGURE 2.

A and B, This patient's baseline image is compared with the 6-month posttreatment image. The images have been matched for size and orientation using the Canfield 7.4.1 imaging software. A mean female torso length of 45 cm is used for calibration. The posttreatment image (B) shows a dramatic reduction in the abdominal profile, extending from the upper abdomen to the pubis. The abdominal projection is reduced by 4.89 cm (18.8%). In addition, there is fatty reduction in the flank and lateral gluteal area, which are outside the abdominal treatment zone. The lateral thigh measurement is also reduced by 2.64 cm (13.9%). Adapted from Samuels et al.6
