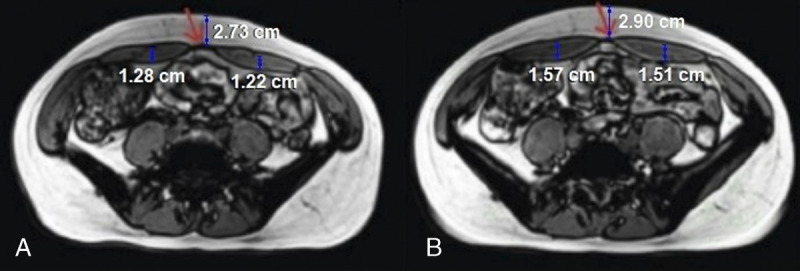
FIGURE 4.

A and B, Magnetic resonance imaging images of a 38-year-old woman are compared before and 3 months after a course of 4 electromagnetic treatments. The abdominal fat thickness is 2 mm greater, and the muscle thickness is 3 mm greater in the posttreatment image (B). The images are taken at slightly different levels, as evidenced by the linea alba partially visible below the red arrow in the before image (A), but not in the after image (B). A 34-cm hip width is used for calibration. Adapted from Jacob and Rank.19
