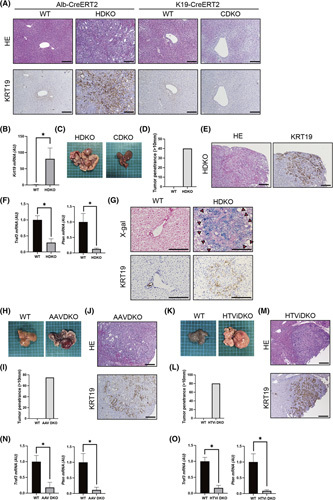
FIGURE 2.

ICCs originate from Traf3/Pten‐deficient hepatocytes. Liver phenotypes were examined in WT mice, hepatocyte‐specific Pten and Traf3 DKO (HDKO) mice, cholangiocyte‐specific Pten and Traf3 DKO (CDKO) mice, and mice with hepatocyte‐specific Pten and Traf3 knockout following the administration of AAV8‐thyroxine binding globulin Cre (AAVDKO) or pEF‐iCre through HTVi (HTViDKO). (A) Hematoxylin and eosin and KRT19 staining of HDKO or CDKO and WT mice at 12 weeks of age. Scale bars, 50 μm. (B) Gene expression levels in HDKO and WT mice at 12 weeks of age. n = 3 per group, *p < 0.05. (C) Macro images of HDKO and CDKO mice at 24 weeks of age. (D) Tumor penetrance (>10 mm) of HDKO mice and WT mice at 24 weeks of age. (E) Hematoxylin and eosin staining and KRT19 staining of HDKO mice at 24 weeks of age. Scale bars, 50 μm. (F) Gene expression levels in tumors from HDKO mice and livers of WT mice. n = 3 per group, *p < 0.05. (G) X‐gal and KRT19 staining of HDKO and WT mice at 12 weeks of age. Scale bars, 50 μm. (H) Macro image of WT and AAV DKO mice. (I) Tumor penetrance (>10 mm) of AAV DKO mice and WT mice. (J) Hematoxylin and eosin and KRT19 staining of AAV DKO mice. Scale bars, 50 μm. (K) Macro image of WT and HTVi DKO mice. (L) Tumor penetrance (>10 mm) of HTVi DKO mice. (M) Hematoxylin and eosin and KRT19 staining of HTVi DKO mice. Scale bars, 50 μm. (N,O) Gene expression levels in AAV DKO tumors and WT mice (N) and HTVi DKO tumors and WT mice (O), n = 3 per group, *p < 0.05. HE, hematoxylin and eosin
