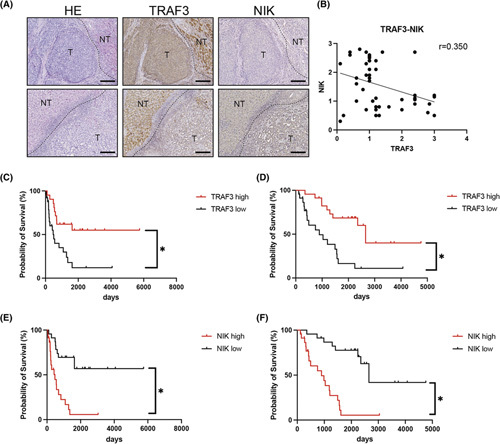
FIGURE 6.

Dysregulation of the TRAF3–NIK axis is associated with advanced stage and poor prognosis of human ICC. (A) Representative images of ICCs with low TRAF3 expression and high NIK expression (upper panels) and ICCs with high TRAF3 expression and low NIK expression (lower panels). (B) Correlation between TRAF3 and NIK staining intensity in tumor tissue of patients with ICC. Scale bars, 50 μm. DFS (C) and OS (D) based on TRAF3 staining intensity in patients with ICC. DFS (E) and OS (F) based on NIK staining intensity in patients with ICC. HE, hematoxylin and eosin; NT, nontumor; T, tumor
