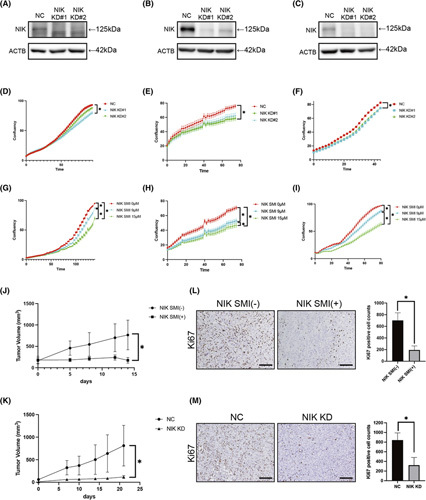
FIGURE 7.

NIK inhibition could represent a potential therapeutic for ICC. Cell phenotypes were examined in HuCCT1, HuCCA1, and KKU232 cells with knockdown of MAP3K14, MAP3K14 shRNA, or control. (A–C) Western blot in HuCCT1 (A), HuCCA1 (B), and KKU213 (C) with control or cells with knockdown of MAP3K14. (D–F) Cell growth curve of HuCCT1 (D), HuCCA1 (E), and KKU213 (F) cells treated with knockdown of NIK analyzed by IncuCyte. n = 8 per group, *p < 0.05. (G–I) Cell growth curves of HuCCT1 (G), HuCCA1 (H), and KKU213 (I) cells with NIKSMI analyzed by IncuCyte. n = 8 per group, *p < 0.05. (J,L) HuCCT‐1 cells were injected s.c. into NOG mice. Mice were orally treated with or without NIKSMI twice a day at a dose of 200 mg/kg. Tumor volumes were measured at various times after treatment, n = 7 per group, *p < 0.05 (J). Ki67‐positive cell counts of HuCCT1 xenograft tumor tissues, n = 7 per group, *p < 0.05. Scale bars, 50 μm (L). (K,M) HuCCT‐1 cells lentivirally transfected with NIK shRNA or negative control shRNA wereinjected s.c. into NOG mice. Tumor volumes were measured at various times, n = 7 per group, *p < 0.05 (K). Ki67‐positive cell counts of HuCCT1 xenograft tumor tissues, n = 7 per group, *p < 0.05. Scale bars, 50 μm (M). ACTB, actin beta; NC, negative control; NIK KD, MAP3K14 shRNA; NIK KD#1 and NIK KD#2, cells with knockdown of MAP3K14
