
Figure 6.
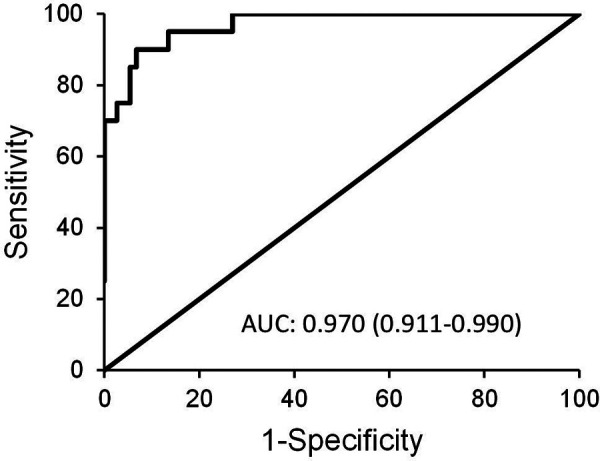
ROC curve depicting the diagnostic power of combined use of P-SEP with IL-6 and CRP in between-group comparison of low-risk vs. high-risk group.
Official websites use .gov
A
.gov website belongs to an official
government organization in the United States.
Secure .gov websites use HTTPS
A lock (
) or https:// means you've safely
connected to the .gov website. Share sensitive
information only on official, secure websites.
ROC curve depicting the diagnostic power of combined use of P-SEP with IL-6 and CRP in between-group comparison of low-risk vs. high-risk group.