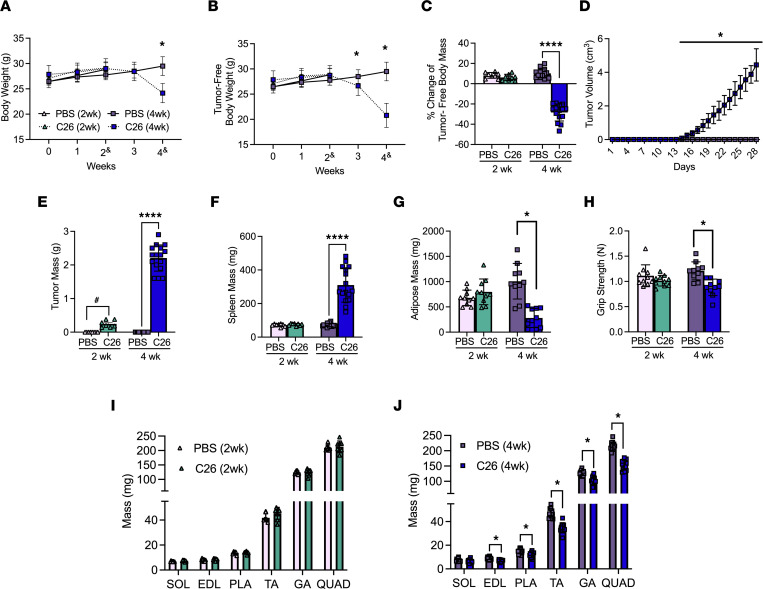
Figure 1. The effects of C26 colon cancer cells’ implantation on body size, tumor size, muscle mass’ and force.
Analysis of CD2F1 mice with subcutaneous C26 implantations or with PBS were performed. Body weights (A, n = 8–16) and tumor-free body weights (B, n = 8–16) were analyzed every week (2& mice were measured at a 14- to 17-day window, and 4& mice were measured on a 26- to 29-day window). Percentage change in tumor-free body weights were analyzed from day 0 to endpoint (C, n = 8–16). In vivo tumor volume measurements were made using calipers (D, n = 16). Tumor mass (E, n = 7–16) and spleen mass (F, n = 8–16) measurements were also completed. Subcutaneous fat from the inguinal fat depot was weighed (G, n = 10). Grip strength was assessed in all groups (H, n = 10). Evaluations of hind limb muscle wet weights were made in the 2-week cohort (I, n = 8) and 4-week cohort (J, n = 16). Results represent mean ± SD; 2-tailed t tests were used to determine the difference between PBS(2wk) vs. C26(2wk) and PBS (4wk) vs. C26(4wk). One-way ANOVA was used to determine the difference between PBS(4wk) vs. C26(4wk) tumor growth. #P < 0.05 PBS(2wk) vs. C26(2wk); *P < 0.05 PBS(4wk) vs. C26(4wk); ****P < 0.0001 PBS(4wk) vs. C26(4wk).

