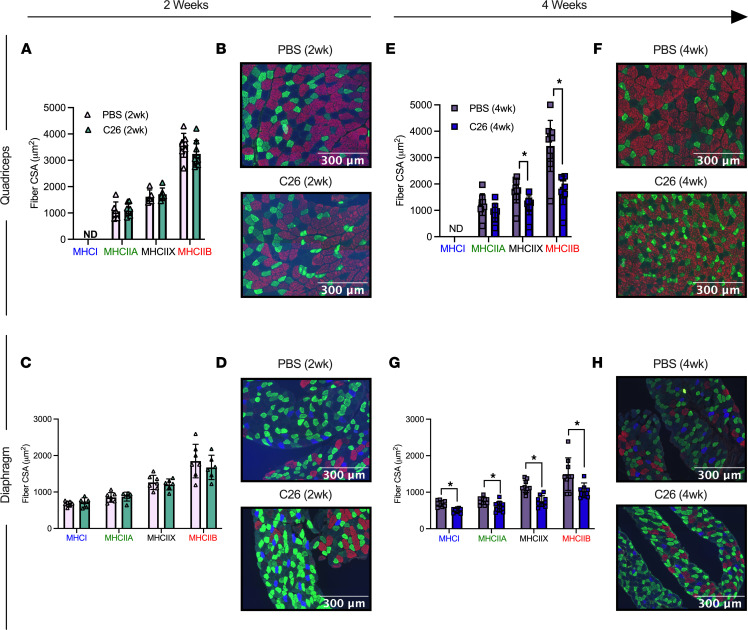
Figure 2. Evaluation of quadriceps and diaphragm fiber type atrophy in skeletal muscle from C26 tumor–bearing mice.
Analysis of fiber histology on MHC isoforms of PBS and C26 mice was performed. CSA of MHC stains was evaluated in the quadriceps (A, n = 8; B, representative image; original magnification, ×20) and diaphragm at 2 weeks of tumor bearing (C, n = 6; D, representative image; original magnification, ×20). The same was completed for the quadriceps (E, n = 9; F, representative image; original magnification, ×20) and diaphragm at 4 weeks of tumor bearing (G, n = 9; H, representative image; original magnification, ×20). Results represent mean ± SD; 2-tailed t tests were used to determine the difference between PBS(2wk) versus C26(2wk) and PBS (4wk) versus C26(4wk). *P < 0.05 PBS (4wk) versus C26(4wk).

