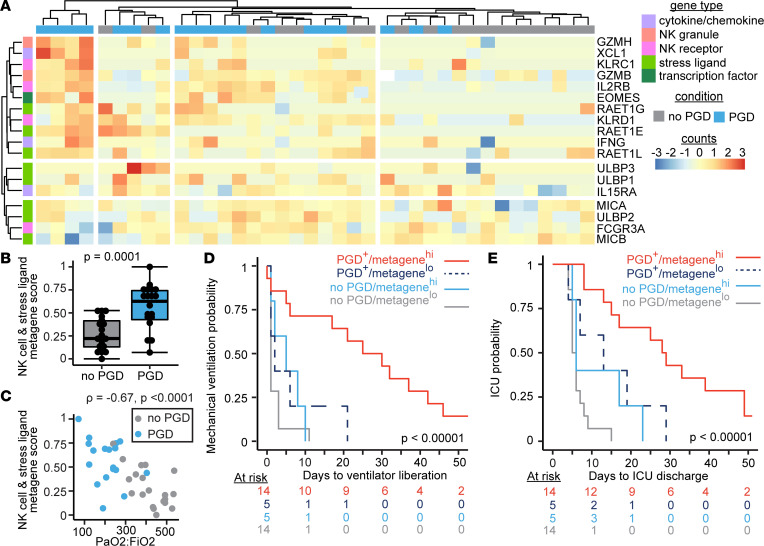
Figure 2. NK cell and stress ligand gene expression profiles are associated with PGD.
A BAL NK cell and stress molecule gene score was generated from RNA-Seq obtained from 38 participants on the first day after lung transplantation (severe PGD, N = 19). (A) A heatmap displays normalized gene counts for the genes included in the score. (B) NK cell NKG2D receptor ligand stress molecule gene score in PGD. (C) Correlation plot of gene score plotted against arterial oxygen pressure relative to the fraction of inspired oxygen (PaO2/FiO2 ratio). (D) Kaplan-Meier plot of mechanical ventilation time stratified by NK cell and stress molecule gene scores and PGD. (E) Kaplan-Meier plot of ICU LOS stratified by NK cell and stress molecule gene scores and PGD. Heatmap data display row-normalized gene counts. Summary data are displayed with box-and-whisker plots illustrating individual data points, bound by boxes at 25th and 75th percentiles, and with medians depicted with bisecting lines. Individual P values are shown, and differences assessed with Mann Whitney U test (B), Spearman’s correlation (C), and log-rank test for Kaplan-Meier plots of mechanical ventilation (D) and ICU survival times (E).

