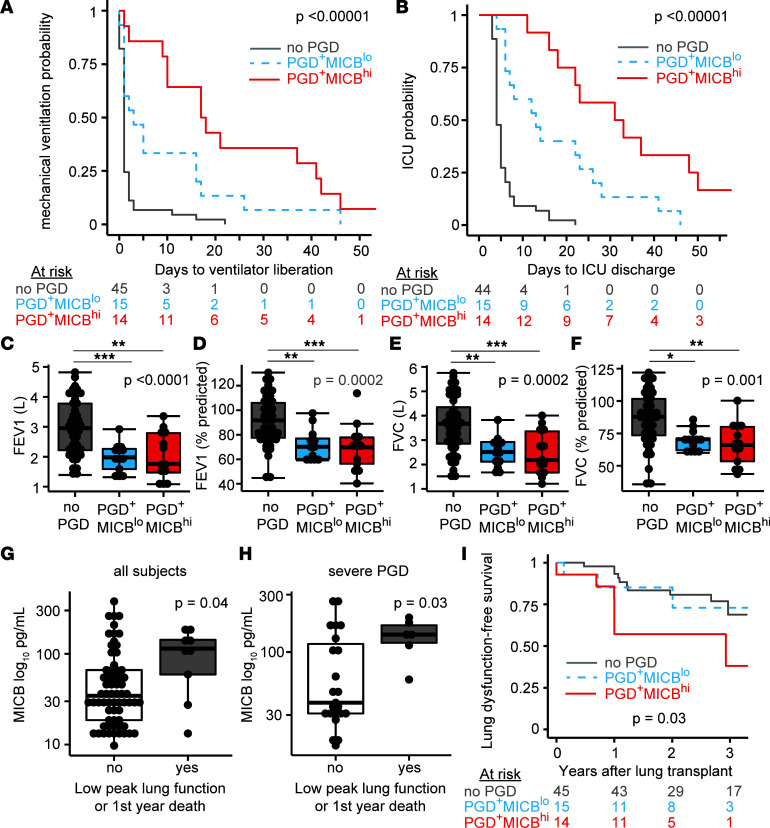
Figure 4. MICB NKG2D stress molecule is associated with mechanical ventilation time and ICU LOS.
Participants were stratified by the presence of PGD and greater-than-median MICB (PGD+MICBhi, N = 14), the presence of PGD and lower-than-median MICB (PGD+MICBlo, N = 15) and participants without PGD (N = 45). (A) Kaplan-Meier plot of mechanical ventilation time among the 3 groups. (B) Kaplan-Meier plot of ICU LOS among the 3 groups. (C) Forced expiratory volume in 1 second (FEV1) in liters. (D) FEV1 as percent predicted of recipient values. (E) Forced vital capacity (FVC) in liters. (F) FVC as percent predicted of recipient values. (G and H) A composite outcome of moderate impairment in peak lung function and death shown for the whole cohort and participants with severe PGD. (I) Kaplan-Meier plot of freedom from this composite end point. Summary data are displayed with box-and-whisker plots illustrating individual data points, bound by boxes at 25th and 75th percentiles, and with medians depicted with bisecting lines. Individual P values are shown, and differences were assessed by log-rank test for Kaplan-Meier plots (A, B, and I), Kruskal-Wallis test with Dunn test for post hoc analysis (C–F), and Mann Whitney U test (G and H). *P < 0.05, **P < 0.01, ***P < 0.001.

