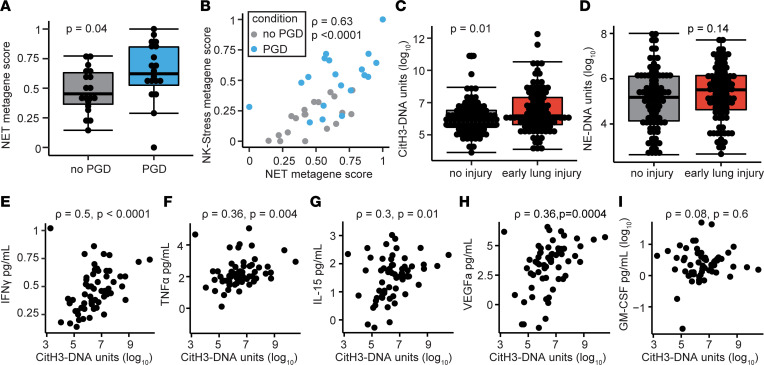
Figure 6. Neutrophil extracellular traps are increased early after transplant and correlate with NK cell cytokines.
(A) NET metagene score is increased in severe PGD. (B) NET metagene score correlates with the NK-stress metagene score. (C) CitH3-DNA complexes are increased in grade 2 or 3 PGD at POD1. (D) NE-DNA complexes are shown at POD1 in grade 2 or 3 PGD compared with grade 0 or 1 PGD. (E–I) CitH3-DNA complexes are correlated with NK cell cytokines IFN-γ, TNF-α, and IL-15, but not with GM-CSF or VEGF-A. Summary data are displayed with box-and-whisker plots illustrating individual data points, bound by boxes at 25th and 75th percentiles, and with medians depicted with bisecting lines. Individual P values are shown, and differences were assessed with Mann Whitney U test and correlations with Spearman’s test.

