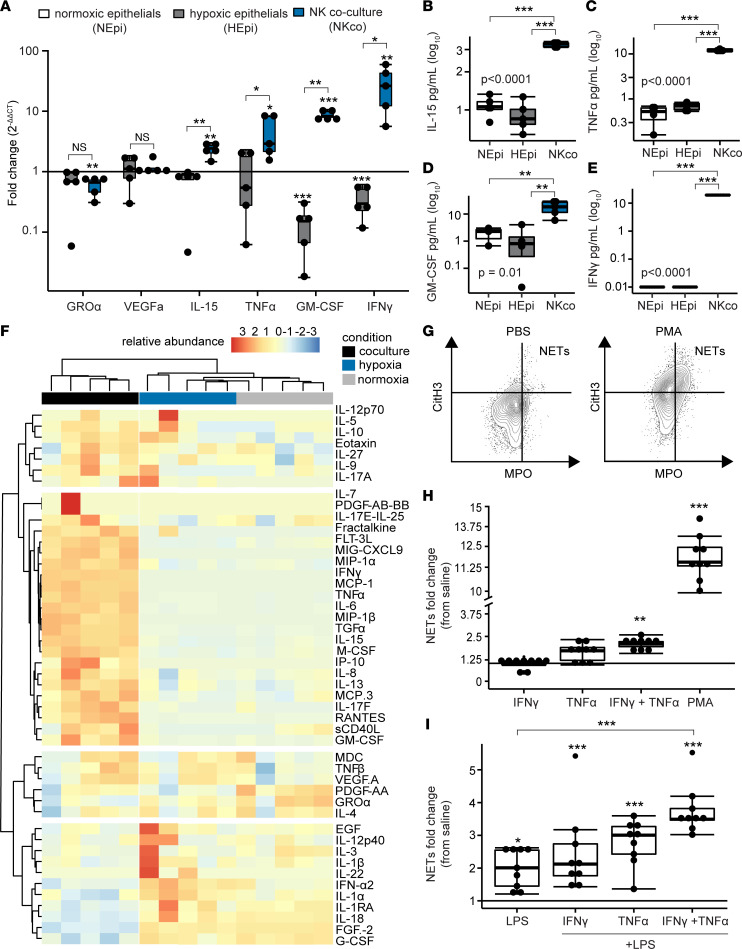
Figure 7. NK cell cytokines induce NETs.
Airway epithelial cells were cultured for 24 hours under normoxic (NEpi, N = 5) or hypoxic (HEpi, P = 5) conditions, and cocultured with NK cells after hypoxia (NKco, N = 5). (A) Cytokine transcripts were measured from each condition. (B–E) Soluble concentrations of cytokines were measured for IL-15, TNF-α, GM-CSF, and IFN-γ. (F) A heatmap displays the relative abundance of cell culture proteins measured within a 70-analyte panel across the 3 conditions. Neutrophil extracellular traps (NETs) were measured with flow cytometry (N = 9 per condition). (G) Representative dot plots are displayed for negative (saline) and positive (PMA) controls. (H) NET fold-change relative to saline controls are shown for neutrophils stimulated with NK cell cytokines. (I) NET fold-change were assessed with neutrophils primed with NK cell cytokines and stimulated with LPS. Summary data are displayed with box-and-whisker plots illustrating individual data points, bound by boxes at 25th and 75th percentiles, and with medians depicted with bisecting lines. Individual P values are shown, and differences were assessed with Mann Whitney U test after Benjamini-Hochberg correction for multiple comparisons. *P < 0.05, **P < 0.01, ***P < 0.001. NEpi, normoxic epithelial cells; HEpi, hypoxic epithelial cells; NKco, NK cell coculture.

