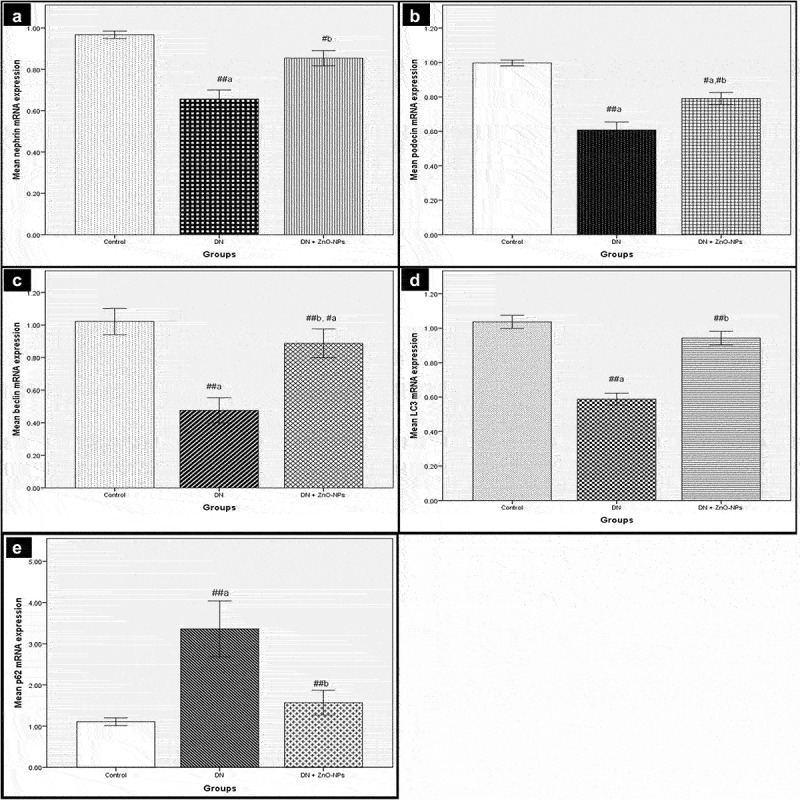
Figure 3.

Real-time PCR analyses of mRNA levels of nephrin, podocin, beclin-1, LC3 and p62 in the renal cortex. Values are displayed as mean ± standard errors (X ± SEM); a: P compared to control group; b: P compared to DN group; #: P< .05; ##: P< .001; n = 10.
