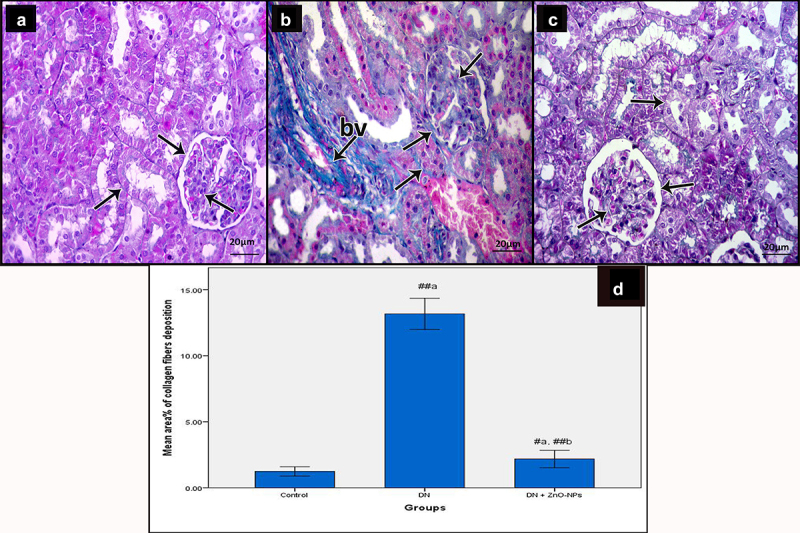
Figure 5.

Mallory’s trichrome stained sections of the renal cortex of the study groups. Collagen fibers (arrow) a Control group, showing few collagen fibers. b DN group, showing increased collagen fibers around renal tubules and renal corpuscles, in between glomerular capillaries and within and around the wall of the blood vessels (bv). c DN + ZnO-NPs, showing nearly normal distribution of collagen fibers. d The mean area % of collagen fibers in Mallory’s trichrome-stained sections. Values are displayed as mean ± standard errors (X ± SEM); a: P compared to control group; b: P compared to DN group; #: P< .05; ##: P< .001.
