Figure 6.

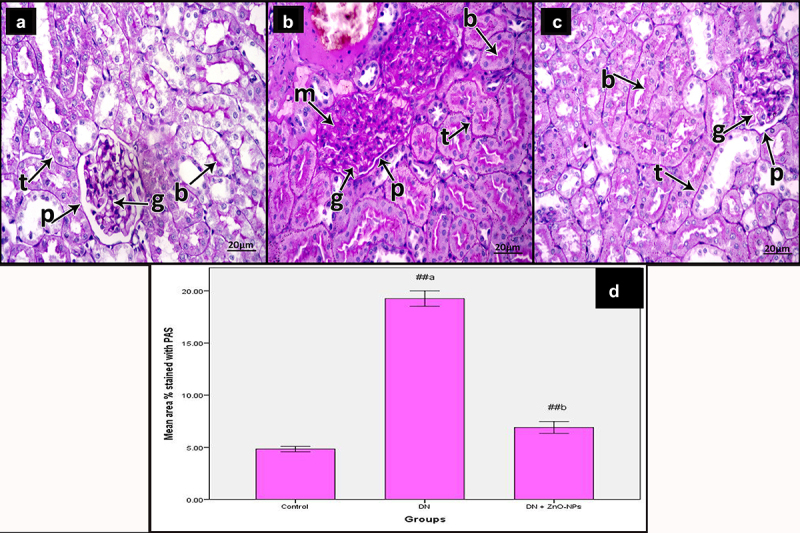
Periodic acid Schiff-stained sections of the renal cortex of the study groups. a Control group, showing reaction in the basement membrane (arrow) of tubular epithelium (t), glomerular capillaries (g) and along with the parietal epithelial cells of Bowman’s space (p). The reaction also appears in the brush borders of the renal tubules (b). b DN group, showing increased reaction in the basement membrane (arrow) of tubular epithelium (t), glomerular capillaries (g) and along with the parietal epithelial cells of Bowman’s space (p) in addition to increased mesangium (m). The reaction is increased in the brush borders of the renal tubules (b). c DN + ZnO-NPs, showing nearly normal reaction in the basement membrane (arrow) of tubular epithelium (t), glomerular capillaries (g) and along with the parietal epithelial cells of Bowman’s space (p). The reaction also appears in the brush borders of the renal tubules (b). d The mean area % of positive reactions in PAS-stained sections, values are displayed as mean ± standard errors (X ± SEM); a: P compared to control group; b: P compared to DN group; #: P< .05; ##: P< .001.
