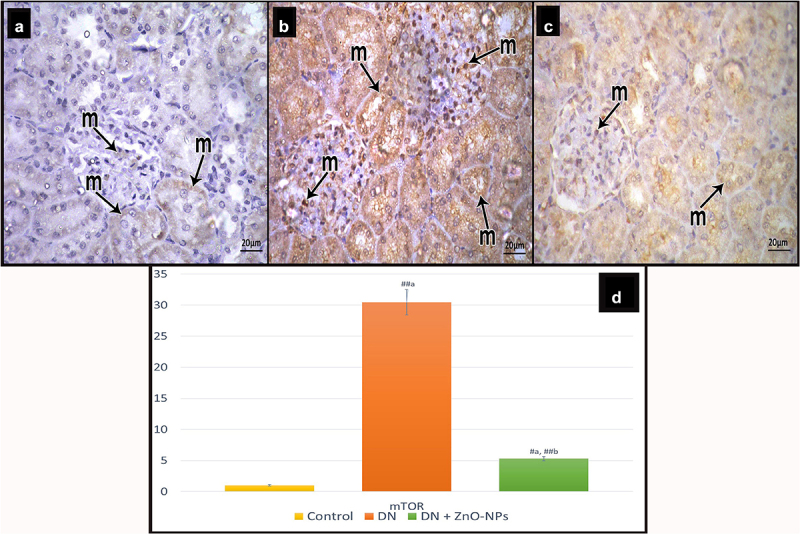
Figure 9.

Immune histochemical-stained sections for mTOR showing cytoplasmic and nuclear immune reaction (m). a Control group, few mTOR immunoreactive cells can be detected. b DN group, showing increased mTOR immune reactions both in the tubular and the glomerular cells. c DN + ZnO-NPs group, some immune reactive cells are seen. d The mean area % of positive immunoreactions in anti-mTOR immune-stained sections. Estimates are displayed as mean ± standard errors (X ± SEM); a: P compared to control group; b: P compared to DN group; #: P< .05; ##: P< .001.
