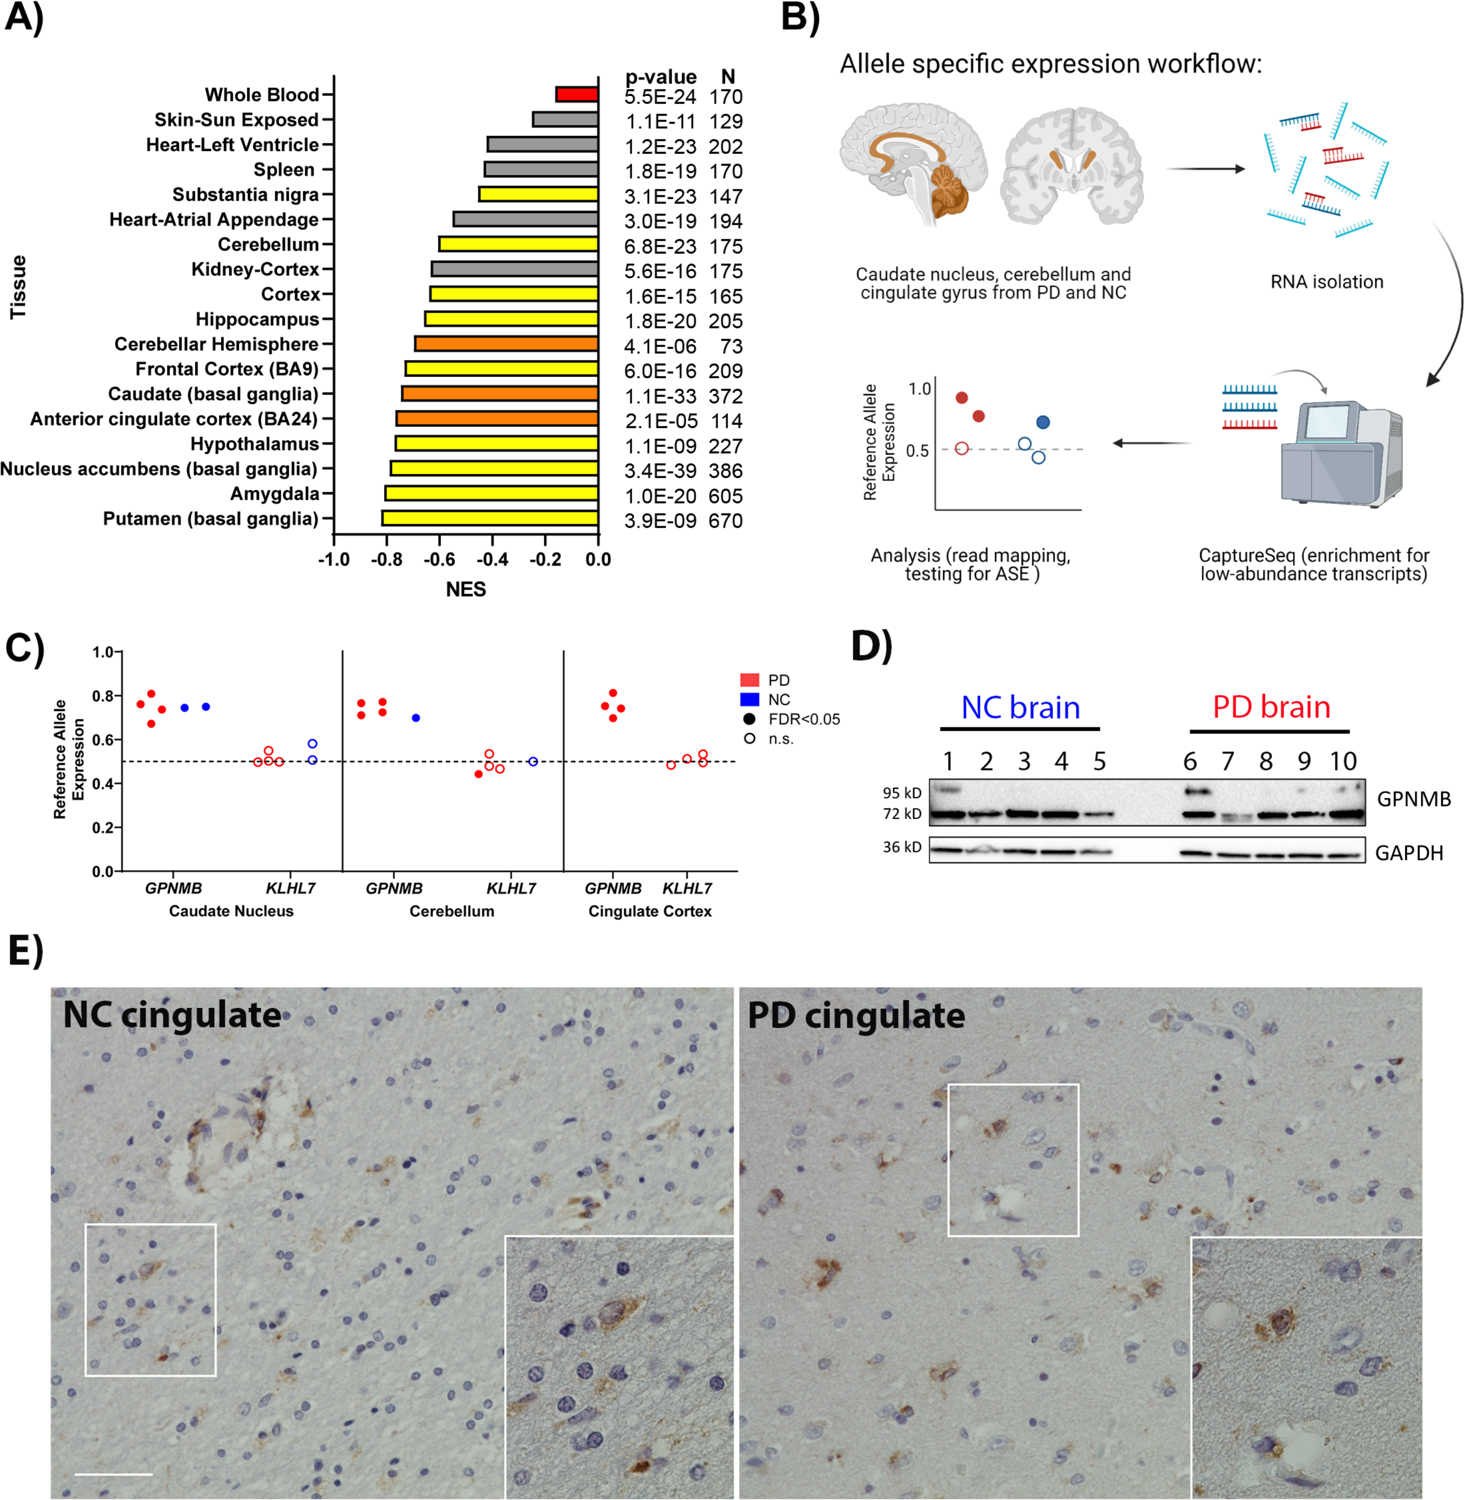
Fig. 1. Chromosome 7 PD risk locus is a multi-tissue GPNMB eQTL and shows allele-specific expression (ASE).

(A) GTEx normalized expression size (NES) coefficients for rs199347’s effect on GPNMB expression in various tissues (10). Red indicates whole blood, yellow and orange indicate brain regions. Orange bars correspond to brain regions analyzed for ASE. The PD risk allele at rs199347 (allele = A) is uniformly associated with higher GPNMB mRNA expression. (B) Workflow for ASE experiment in brain samples from PD patients (n = 4) and neurologically normal controls (NC, n = 2). (C) ASE analysis for rs199347 target gene candidates GPNMB and KLHL7 in caudate, cerebellum, and cingulate cortex brain samples of PD (red) and NC (blue) individuals heterozygous at this locus. Shaded dots indicate significant (BH-adjusted p-value < 0.05) ASE, whereas empty dots do not show significant ASE. In the absence of ASE, the allelic ratio would be 0.5. For GPNMB, the allelic ratio approached 0.8, with higher expression for the GPNMB allele carrying the PD risk haplotype. (D) Immunoblots showing GPNMB expression in caudate brain lysates from NC (n=5) and PD (n=5) individuals. A 72kD band was detected by the E1Y7J antibody in all cases, with variable expression of a higher-molecular weight glycosylated form. A GAPDH loading control is also shown. (E) Representative immunohistochemical staining of GPNMB in NC and PD brain demonstrates expression in multiple cell types. Scale bar = 50um.
