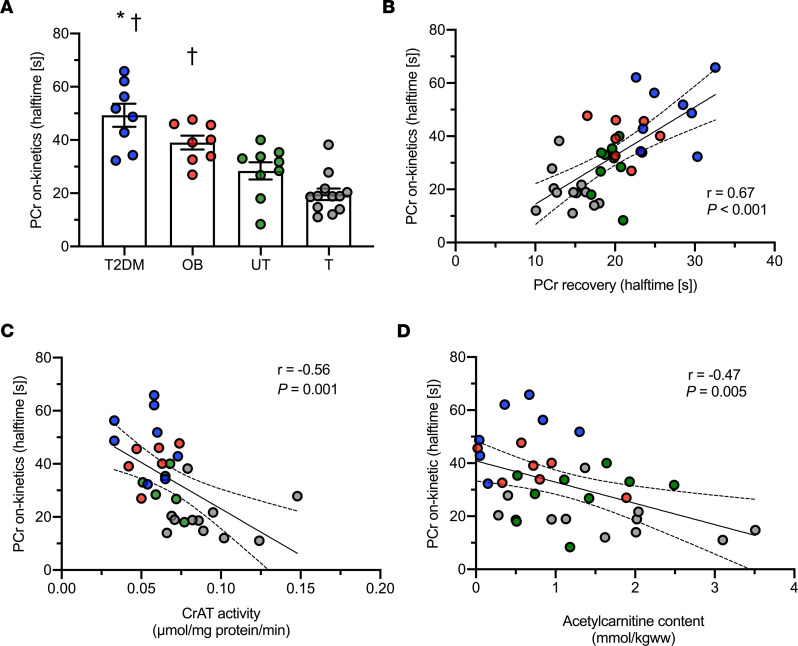
Figure 1. Pronounced skeletal muscle mitochondrial inertia in metabolically compromised individuals.
(A) Halftime of PCr on-kinetics. (B) Linear association between PCr on-kinetics and PCr recovery after exercise. (C) Linear association between PCr on-kinetics and CrAT protein activity. (D) Linear association between PCr on-kinetics and in vivo skeletal muscle acetylcarnitine content. [s], seconds; T2DM, patients with type 2 diabetes; OB, individuals with obesity; UT, lean untrained; T, trained. Circles in blue, T2DM (n = 8); circles in red, OB (n = 8); circles in green, UT (n = 11); circles in gray, T (n = 12). Data are shown as individual points and mean ± SEM. * P < 0.05 versus untrained individuals, †P < 0.05 versus trained individuals. PCr on-kinetics could not be measured in one T2DM patient due to unreliable steady state and, therefore, are excluded for the analysis. Statistical test were 1-way ANOVA with Bonferroni post hoc correction and Pearson’s correlation.

