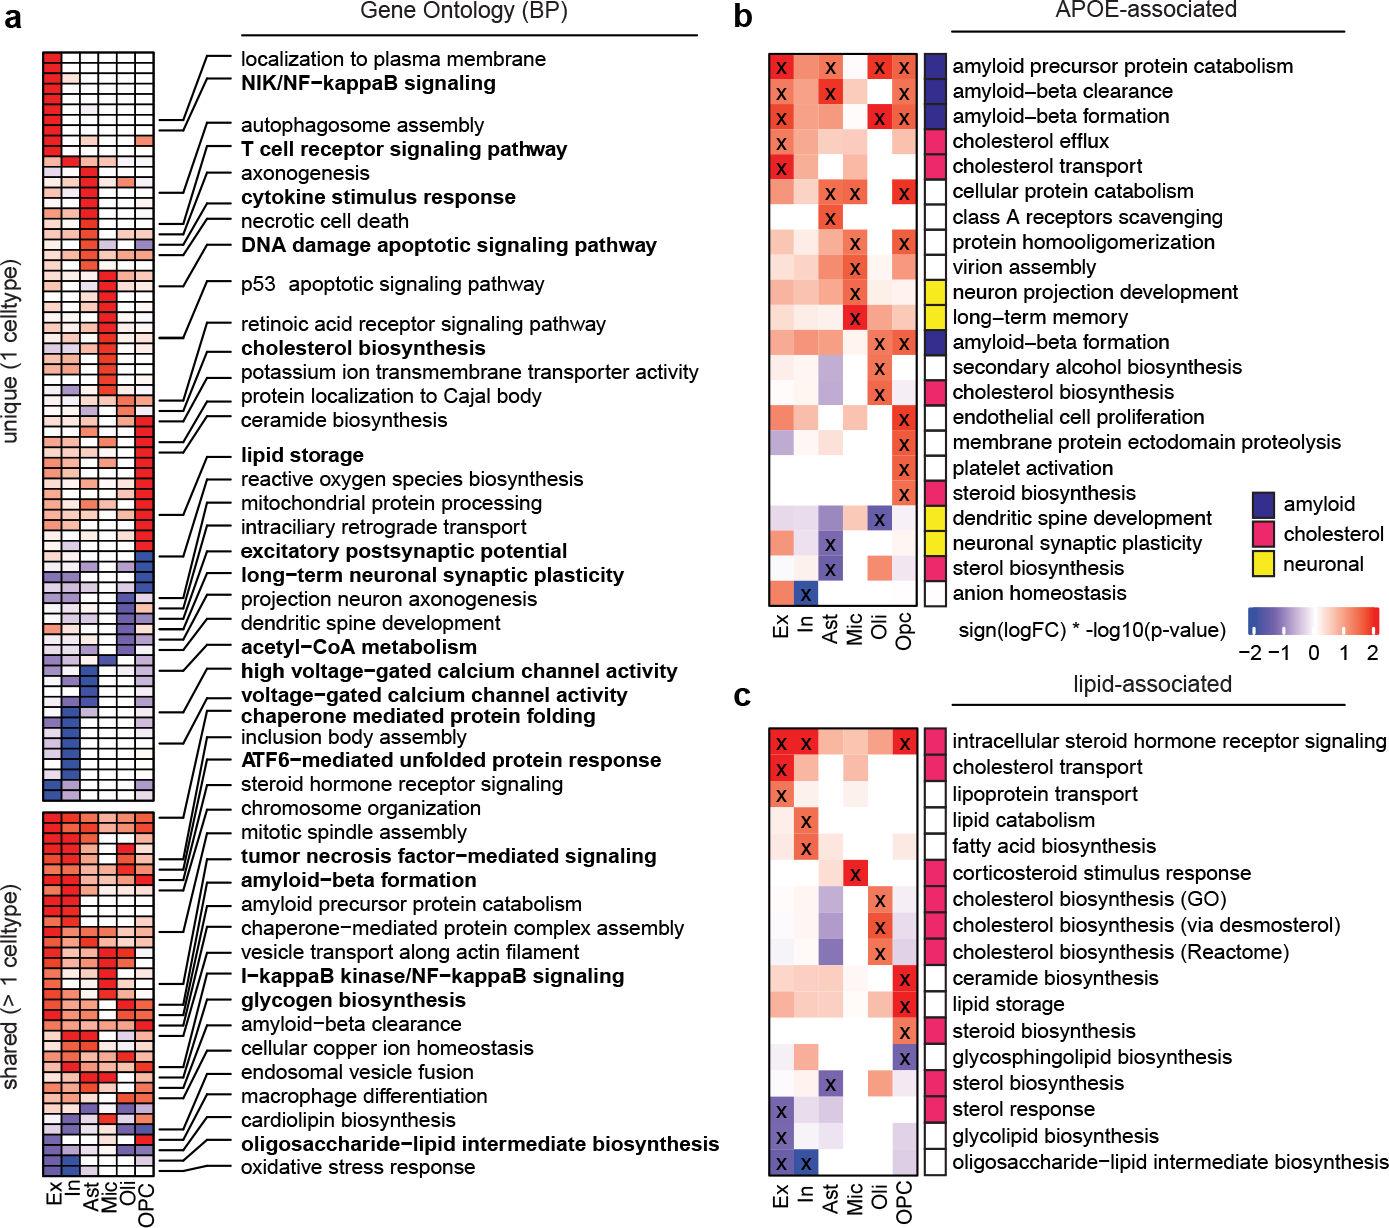
Fig. 1. Cell-type specific APOE4-associated pathway alterations.

a, Top gene ontology biological processes (BP) with expression changes associated with APOE4 (nominal p-value < 0.05, linear model, APOE3/3 vs APOE3/4 and APOE4/4). Red indicates APOE4 up-regulation and blue down-regulated relative to APOE3. Top 20 pathways in order of p-value. Unique alterations indicate evidence (p-value < 0.05) of pathway alteration in a single cell type. Shared alterations indicate evidence in multiple cell types. b, APOE-associated pathways with expression changes associated with APOE4 (nominal p-value < 0.05, linear model, APOE3/3 vs APOE3/4 and APOE4/4). ‘X’ indicates evidence of alteration (p-value < 0.05). Pathways were manually classified into three categories (color box, right). c, Brain-specific lipid-associated pathways (see Methods) with APOE4-associated expression changes (nominal p-value < 0.05, linear model, APOE3/3 vs APOE3/4 and APOE4/4).
