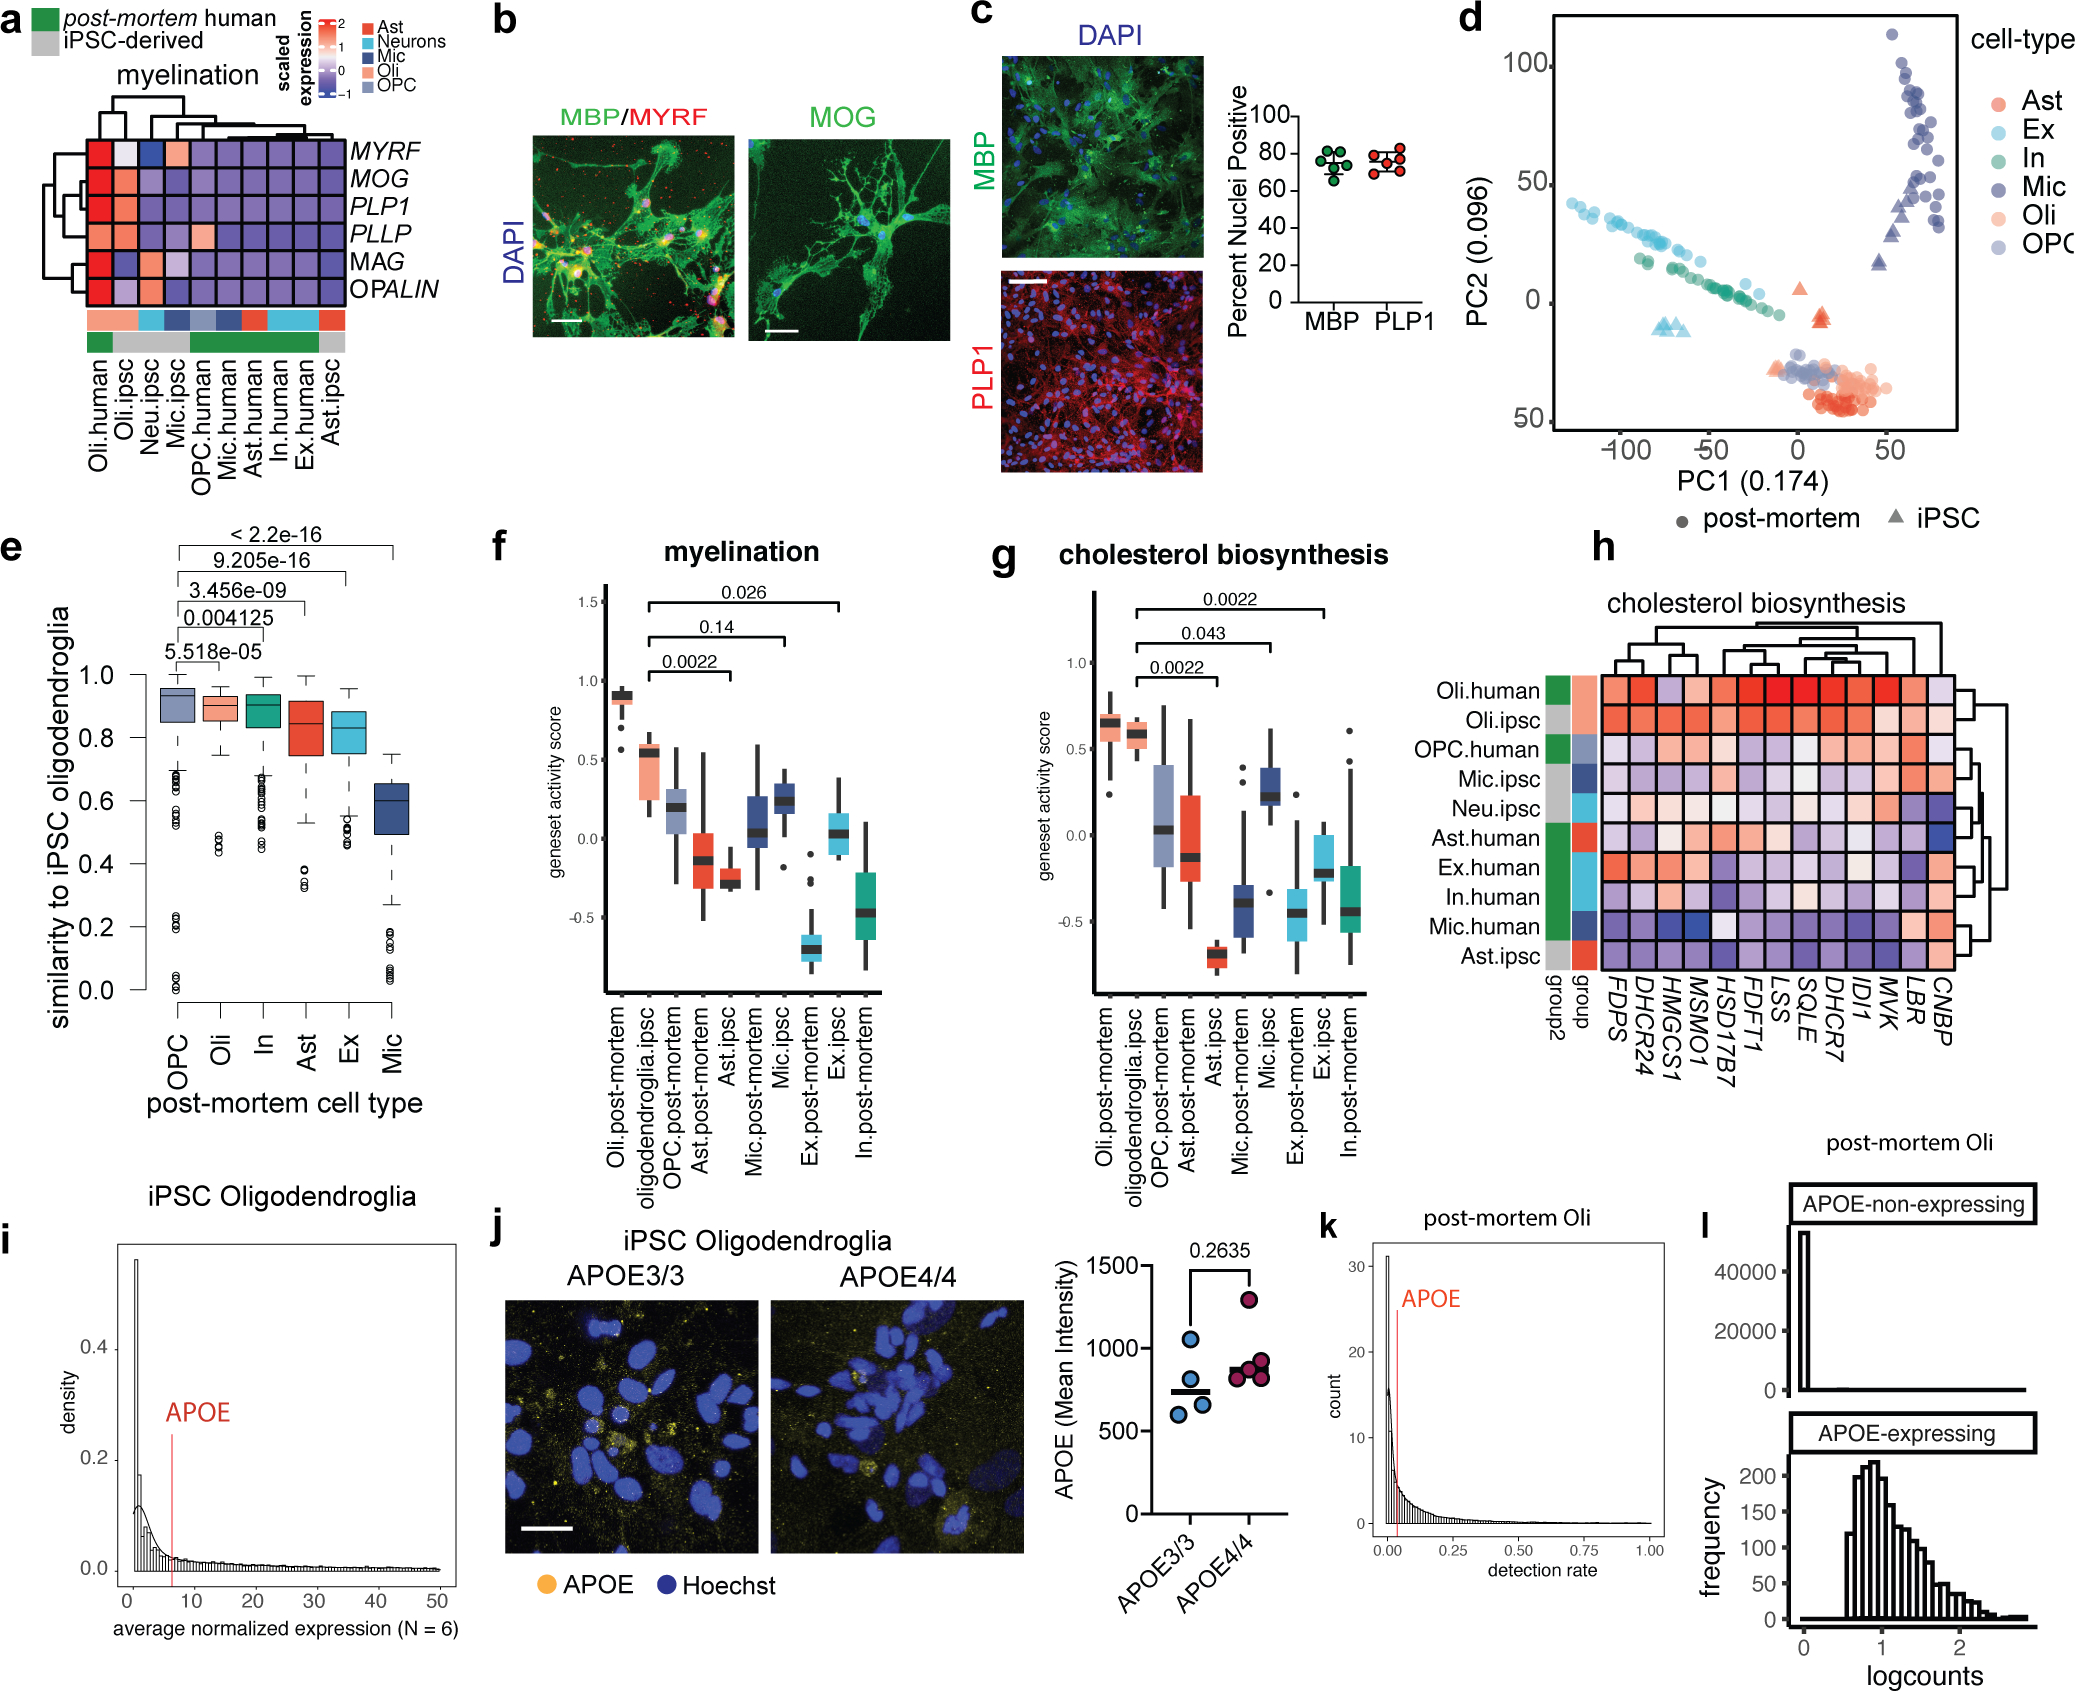
Extended Data Fig. 5. Comparison of post-mortem oligodendrocytes and iPSC-derived oligodendroglia.

a, Comparison of the relative expression of myelination genes (MYRF, MOG, PLP1, PLLP, MAG, OPALIN) in iPSC-derived brain cell types and aggregated cell type gene expression profiles from post-mortem human brain single-nucleus data. b, Staining of MBP, MYRF, and MOG in iPSC-derived oligodendroglia. Scale bar 10 μm. c, Representative images of cultures of iPSC-derived oligodendroglia stained for PLP1 and MBP. Dots represent the percentage of nuclei positive for each marker across independent wells subjected to the same conditions (n = 5 biological replicates). Bars represent mean across all wells, error bars represent standard deviation. d, Principal component analysis of relative gene expression for post-mortem human brain cells and iPSC-derived counterparts. e, Transcriptional similarity between post-mortem human cell types and iPSC-derived oligodendroglia, p values calculated with Wilcoxon test, two-sided. Distributions represent distances between each post-mortem cell type (x-axis) and iPSC oligodendroglia in scaled gene space (N = 32 per post-mortem cell type, N = 6–8 for iPSC cell types). f-g, Gene set activity scores by GSVA on scaled expression values using genes shown in a or h, p value calculated by Wilcoxon test, two-sided. Boxplots indicate median, 25th and 75th percentiles. h, Relative expression of cholesterol-associated genes across iPSC-derived oligodendroglia, post-mortem human brain oligodendrocytes, and additional brain cell types. i, Gene expression distribution in iPSC-derived oligodendroglia. j, APOE immunoreactivity in APOE3/3 (n = 4 biological replicates) and APOE4/4 (n = 5 biological replicates) iPSC-derived oligodendroglia. Dots in right panel plots represent mean from independent images, p values were calculated with an unpaired, two-tailed student’s t-test. k, Distribution of gene nonzero detection rates in human post-mortem oligodendrocytes (snRNAseq). The nonzero APOE detection-rate is circa 4%, corresponding to circa 53rd percentile of genes. l, Distribution of expression levels for APOE-non-expressing (n = 53,095) and APOE-expressing (n = 1,882) post-mortem oligodendrocytes (snRNAseq). Groups were identified by K-means clustering on the non-zero detection rate.
