
Extended Data Fig. 7: Cell stress in APOE4 oligodendrocytes.
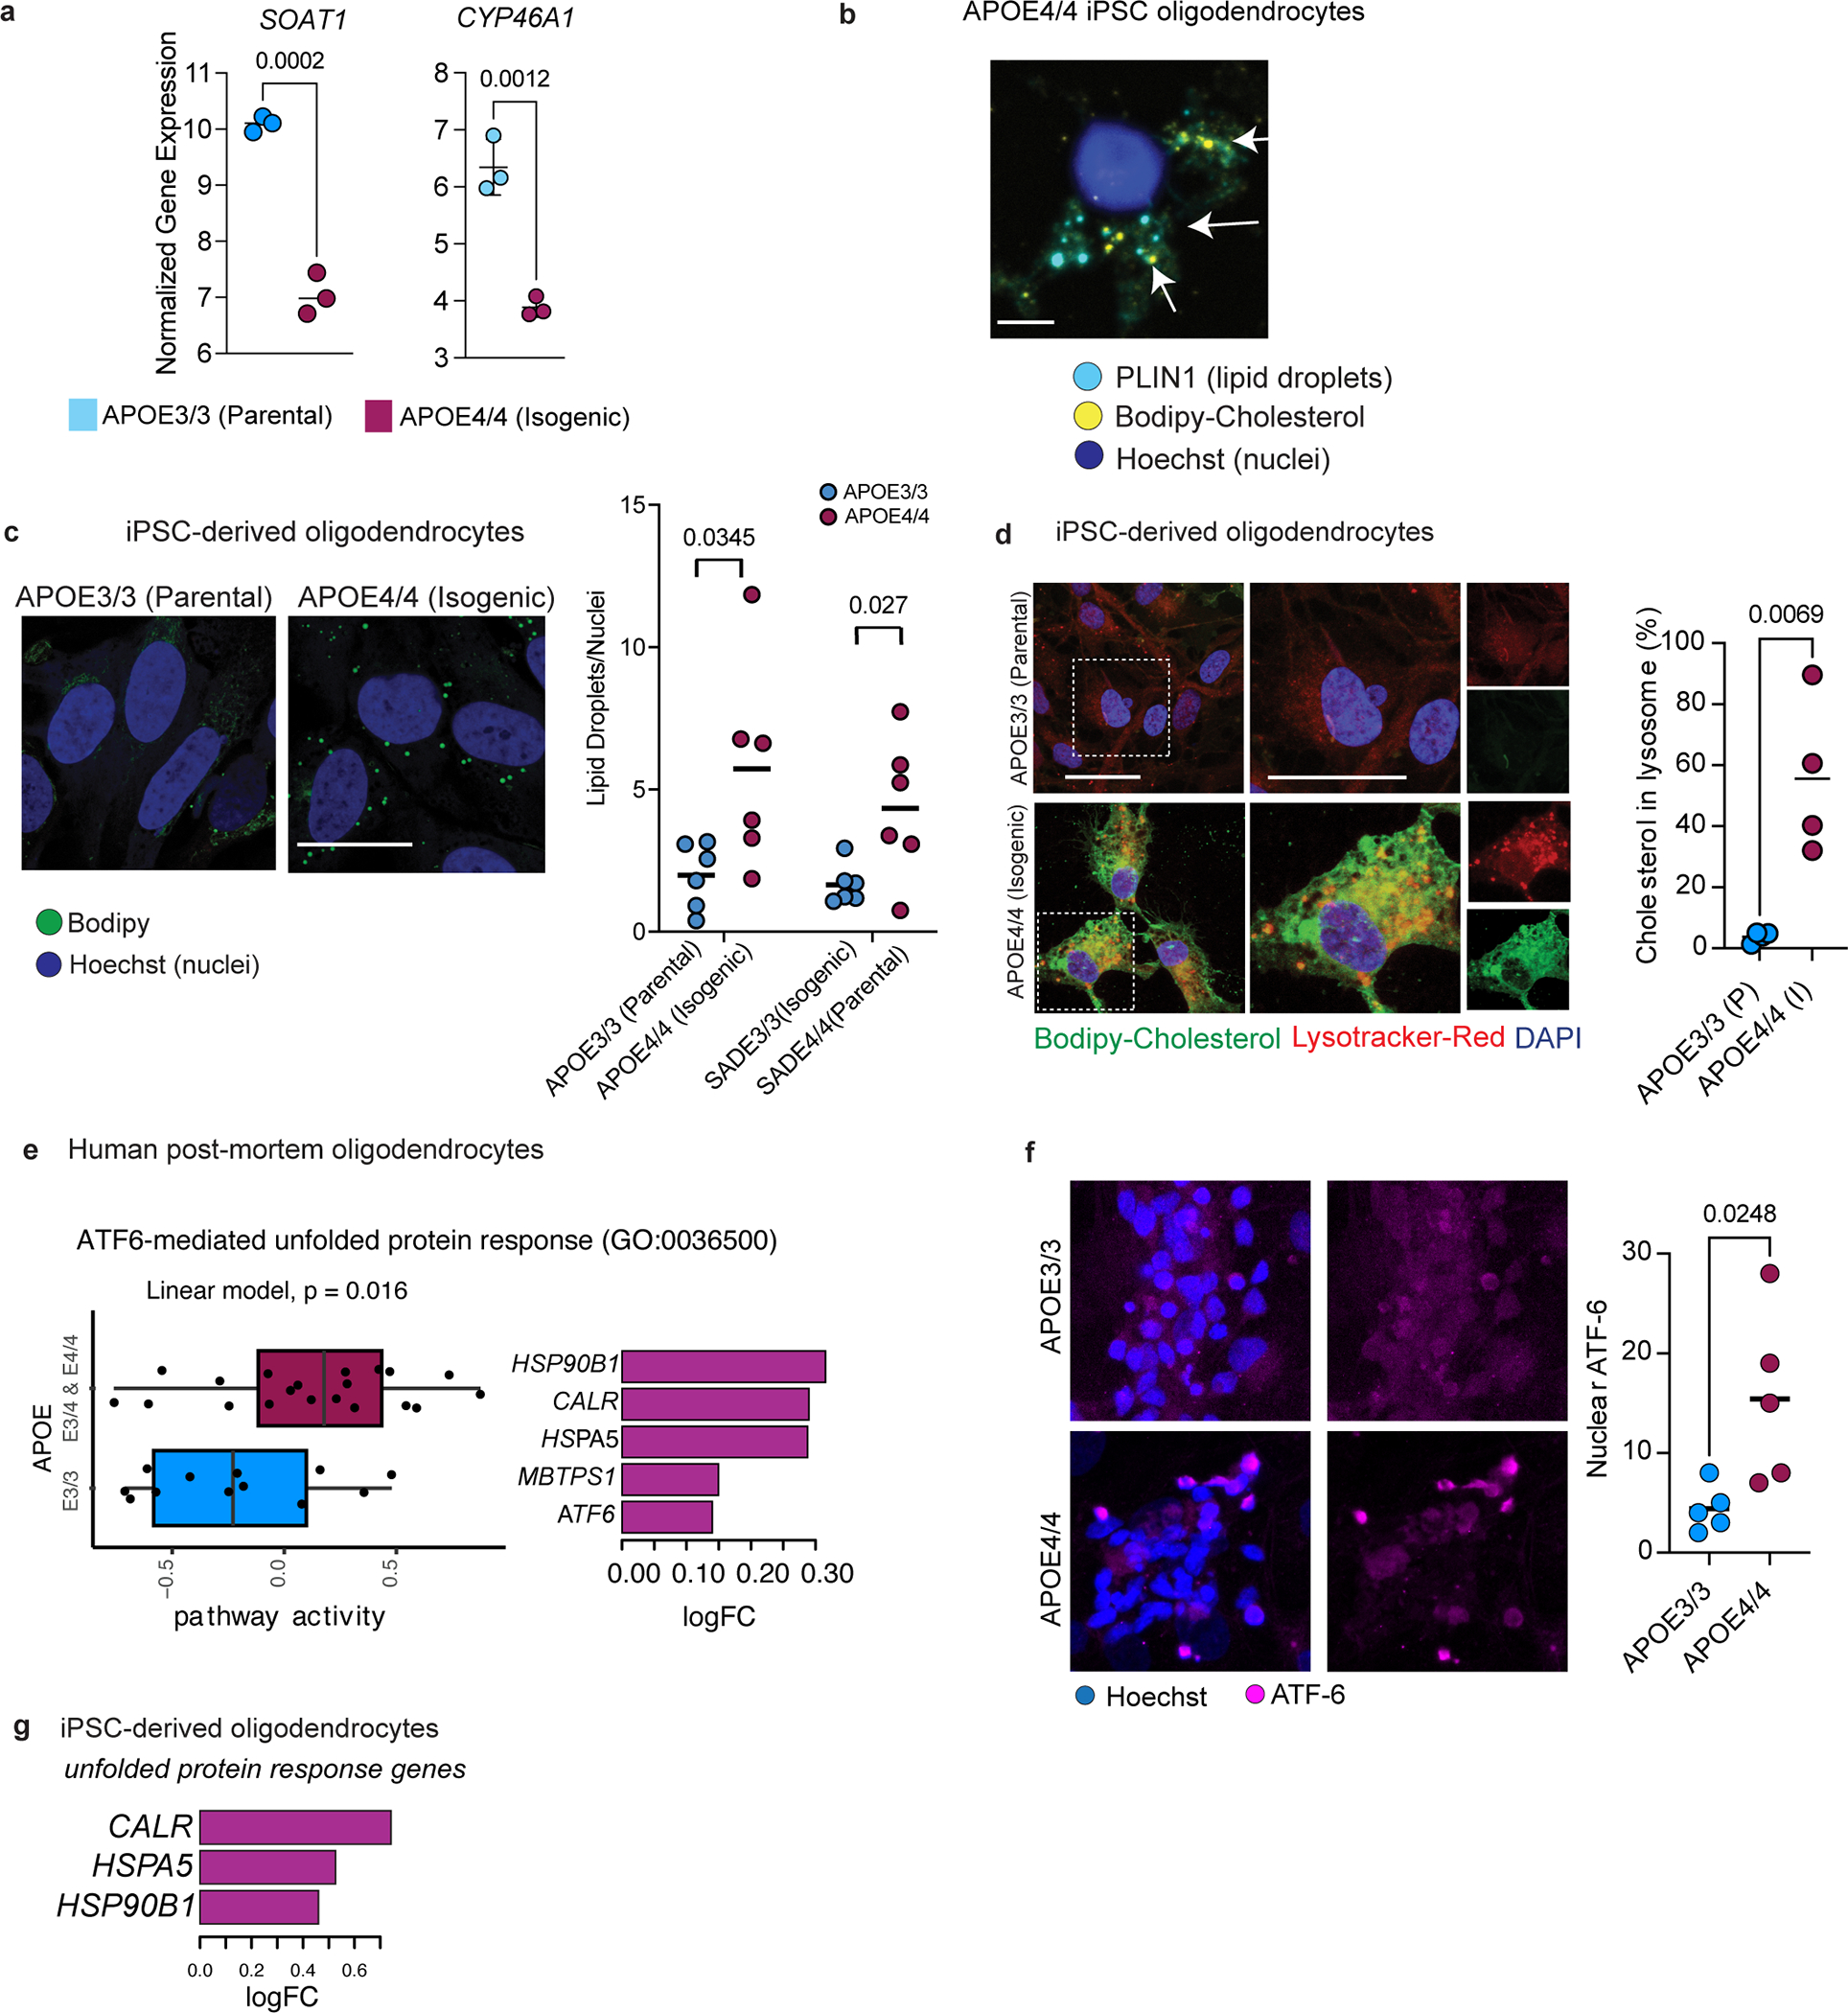
a, mRNA expression levels of SOAT1 (ACAT1) and CYP46A1 from bulk sequencing of isogenic iPSC-derived APOE3/3 and APOE4/4 oligodendroglia (n=3 biological replicates per genotype, adjusted p values shown, computed by linear model). b, Perilipin-1 (PLIN1) immunoreactivity in APOE4/4 iPSC-derived oligodendroglia, and PLIN1 co-localization with Bodipy-cholesterol staining in APOE4/4 iPSC-derived oligodendroglia. c, Representative Bodipy staining for lipid droplets (n = 6 biological replicates). Scale bar represents 10 μm. Lipid droplets were quantified in two different isogenic sets of APOE3/3 and APOE4/4 oligodendroglia, that were generated from different individuals. Data points represent biological replicates and bars show means. p values were calculated using an unpaired, two-tailed student’s t-test. d, Percent of Bodipy-cholesterol staining in lysosome. Quantification was performed using ImageJ software with the same threshold setting for all images and conditions. Data points represent the mean of four images from one biological replicate. Bars represent means from four biological replicates. p value was calculated using unpaired, two-tailed student’s t-test. e, (left) Box plot of ATF-6 mediated unfolded protein response gene set activity (computed by GSVA) in human post-mortem oligodendrocytes. unadjusted p-value = 0.016, linear model. Boxplots indicate median, 25th and 75th percentiles. (right) Pathway gene members that are differentially expressed (FDR < 0.05, negative binomial mixed model) f, Representative images of immunohistochemistry against ATF-6 protein in APOE3/3 and APOE4/4 iPSC-derived oligodendrocytes, and quantification of number of cells with nuclear ATF-6 immunoreactivity (n = 5 biological replicates). Dots represent technical replicates, and bars represent mean per genotype. p value was calculated using an unpaired, two-tailed student’s t-test. g, Fold change for unfolded protein response genes in APOE4/4 vs APOE3/3 oligodendroglia (N = 3 per genotype) from panel e (adjusted p-value < 0.05, negative binomial distribution).