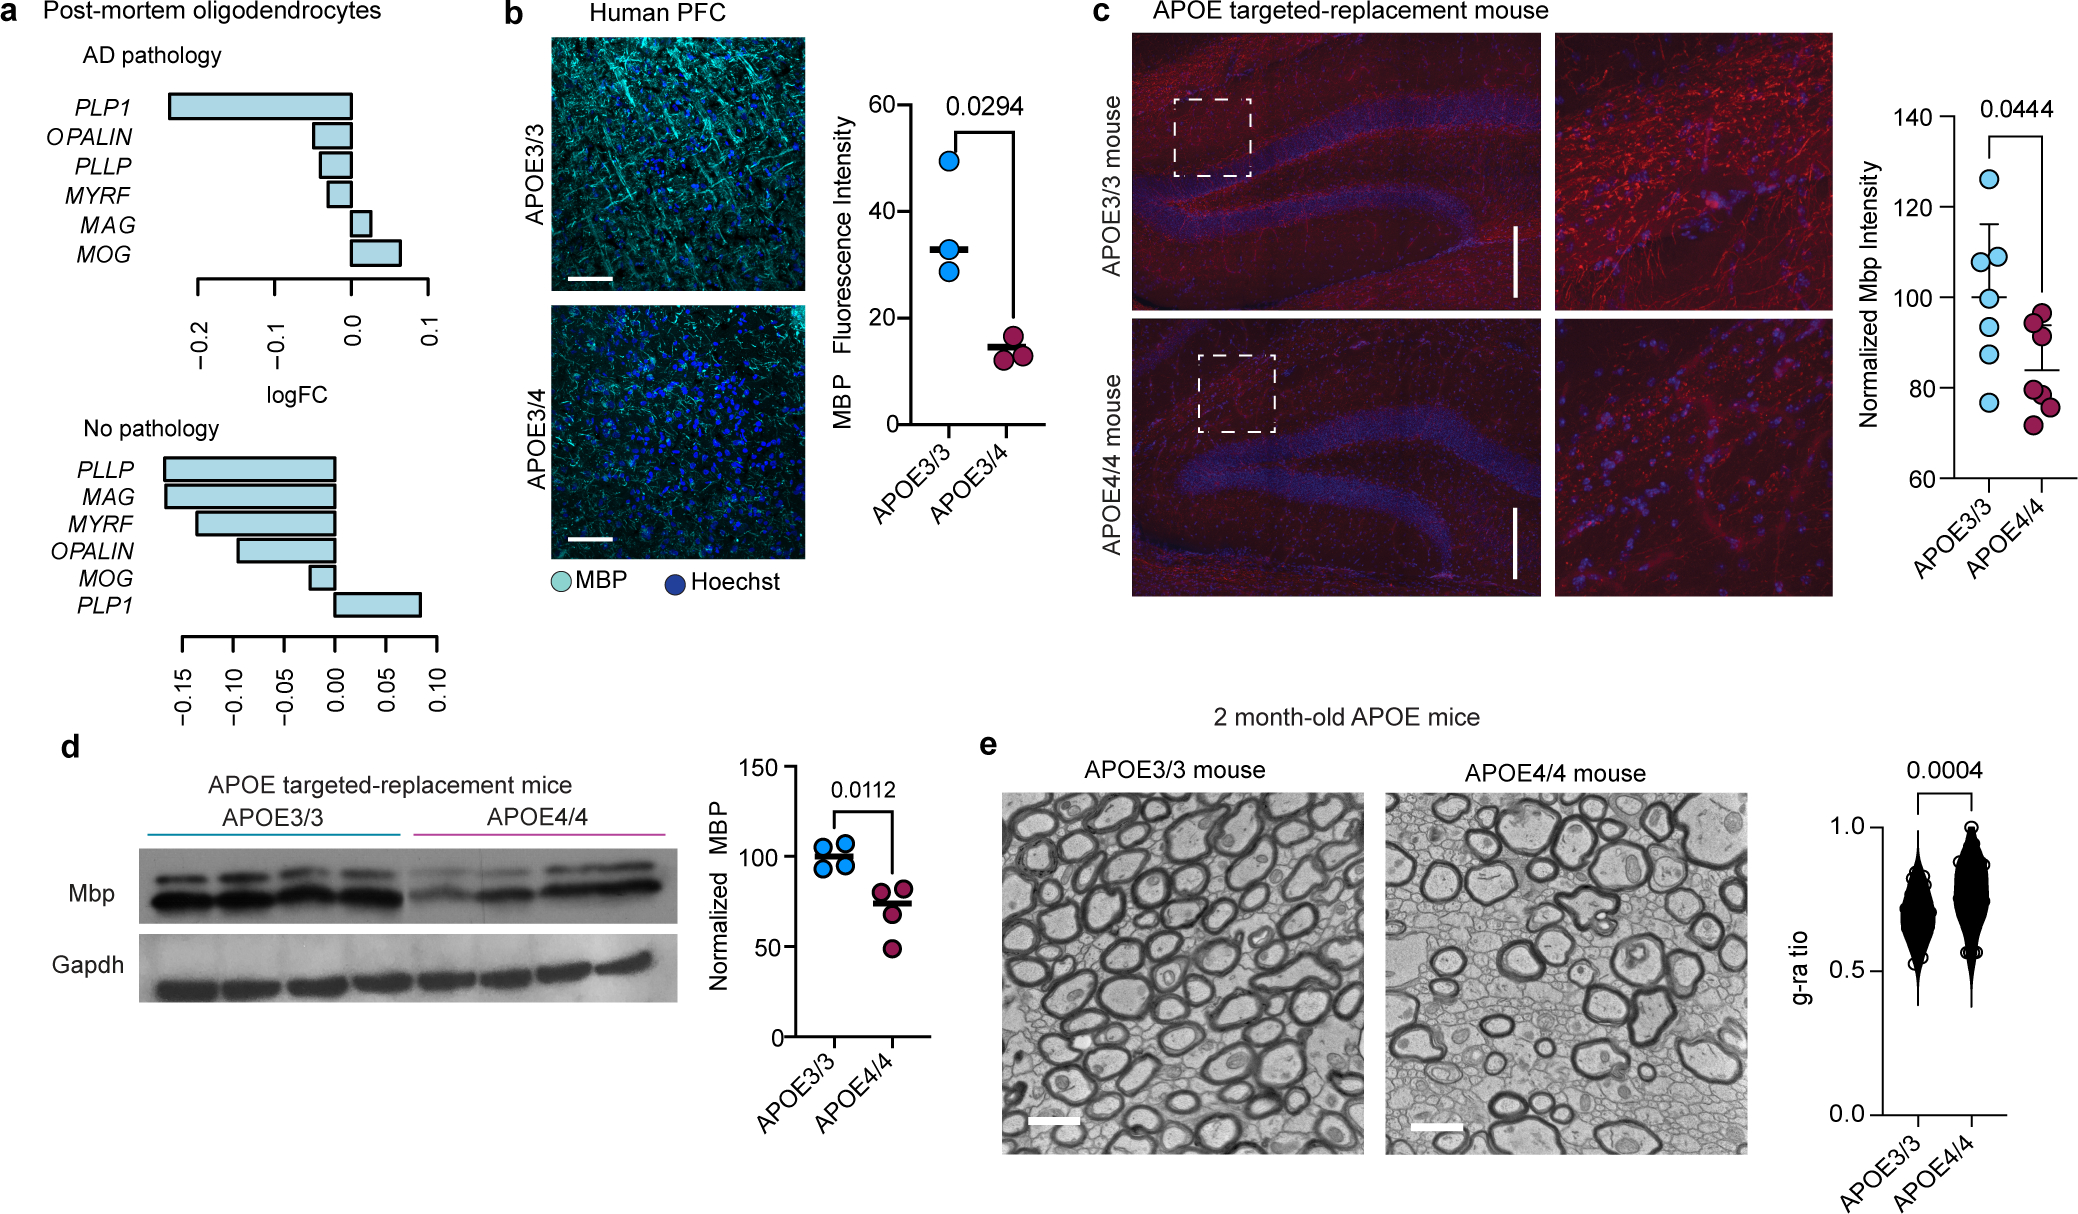
Extended Data Fig. 8: Myelin expression in humans and mice.

a, Myelin-associated gene expression changes in APOE3/3 vs APOE3/4 post-mortem oligodendrocytes for individuals with and without AD pathology (logFC<0 indicates down in APOE3/4; Wilcoxon test by wilcoxauc(), adjusted p value < 0.05). b, Immunohistochemistry for Myelin Basic Protein (MBP) in APOE3/3 and APOE3/4 individuals with AD diagnosis (n=3 per genotype), and quantification. Mean fluorescence intensity quantified using FIJI ImageJ software. Dots represent mean value calculated from four images from one individual, and bars represent mean value from three separate individuals for each genotype. p value was calculated using an unpaired, two-tailed student’s t-test. c, Immunohistochemistry for myelin basic protein (MBP) in hippocampal slices of APOE3/3-TR (n = 7 mice) and APOE4/4-TR (n = 7 mice) at nine months of age, quantified according to mean fluorescence intensity. Quantification was performed using ImageJ. Bars represent mean intensity from all mice for each genotype, and error bars represent standard deviation. p values were calculated using unpaired, two-tailed student’s t-test. Scale bar represent 200 μm. d, Western Blot for Myelin Basic Protein (MBP) in APOE3/3-TR (n=4) and APOE4/4-TR (n=4) mouse cortex at six months of age. Each lane is a brain lysate prepared from a different mouse. Total area and intensity of bands normalized to GAPDH was quantified via ImageJ using mean intensity for each band. Bars represent means. p value was calculated using an unpaired, two-tailed student’s t-test. e, TEM on corpus callosum from APOE3/3-TR (n=3) and APOE4/4-TR (n=3) knock-in mice at 2 months of age. G-ratio was quantified using ImageJ software as stated in Main Figure 4d). Scale bar represents 500 μm. Data points representing g-ratios for axons from each genotype, p value was calculated using an unpaired Wilcoxon test.
