
Fig. 3: APOE4 alters cholesterol homeostasis and localization in iPSC-derived oligodendrocytes.
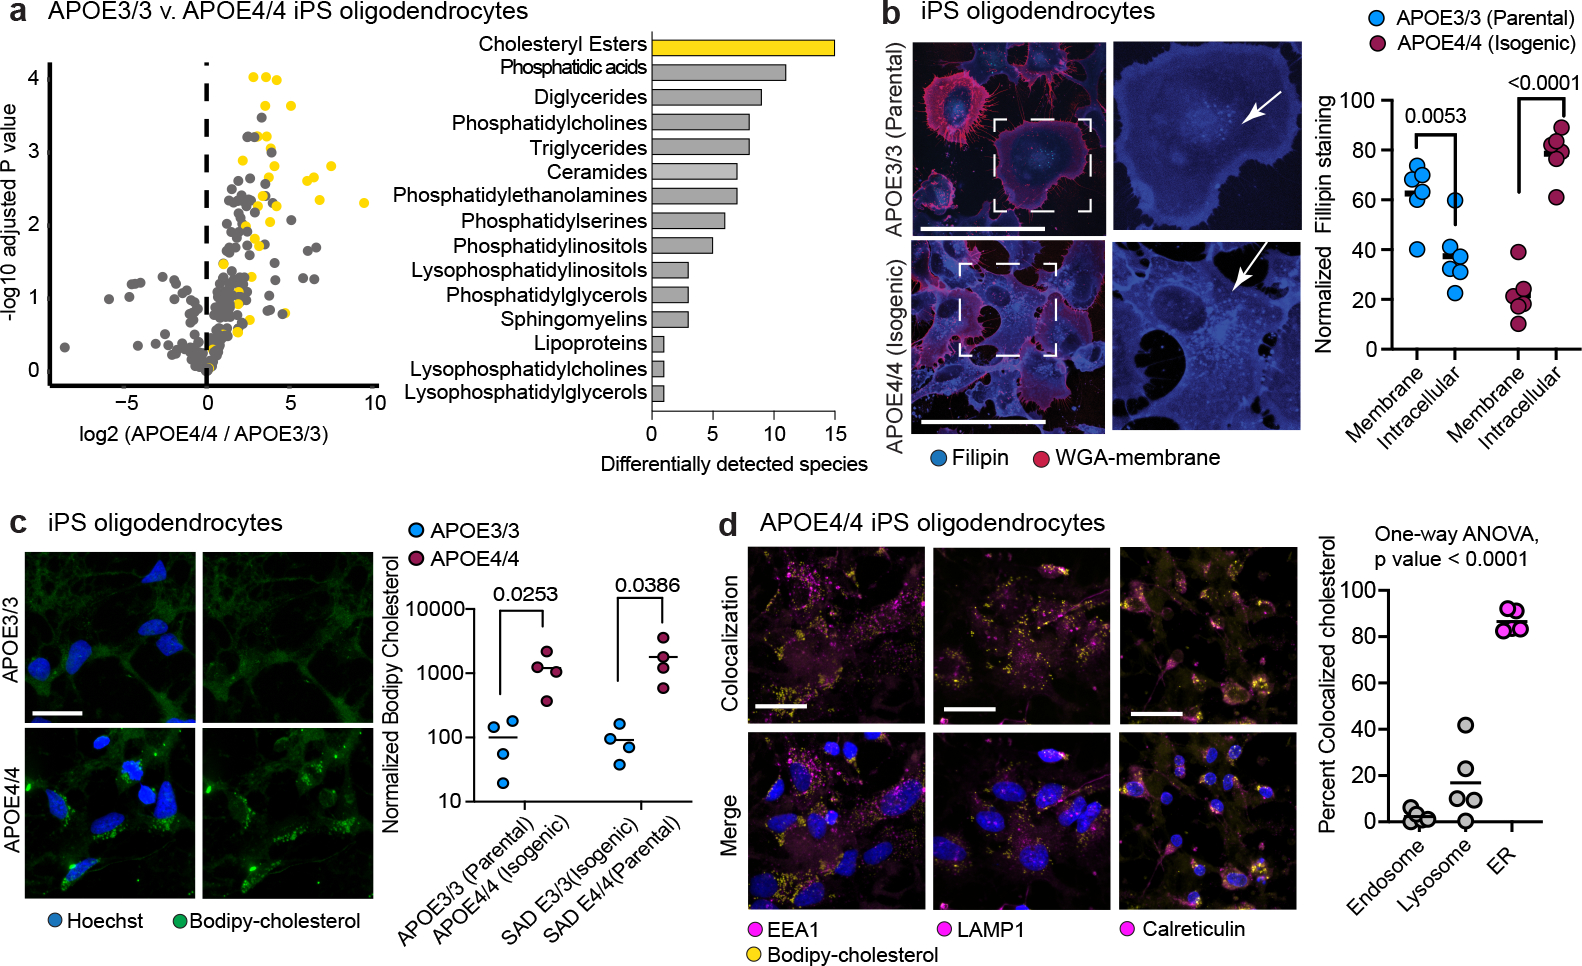
a, Detected lipid-species concentrations from mass spectrometry-based lipidomic profiling of iPSC-derived APOE3/3 and APOE4/4 oligodendroglia. Cholesteryl ester species are highlighted in yellow. Barplot depicts the number of differentially (adjusted p value < 0.05) detected lipid species for each lipid class. Cholesteryl esters are the most frequently differentially detected class, with 15 species upregulated in APOE4 oligodendroglia. b, Representative images of Filipin (cholesterol) and WGA-membrane staining in APOE3/3 and APOE4/4 iPSC-derived oligodendroglia. Arrows highlight altered cholesterol localization in APOE4/4 iPSC-derived oligodendroglia. Filipin intensity was quantified for the cell membrane (localized with WGA) and intracellular compartment (between membrane and nucleus; n=6 replicates from independent experiments), scale bar represents 50 μm. Bars represent means from independent biological replicates, p values were calculated with an unpaired two-tailed student’s t-test. c, Representative images of APOE3/3 and APOE4/4 iPSC-derived oligodendroglia. Bodipy-cholesterol stained oligodendroglia. Bars represent means from independent biological replicates (n=4 per genotype), and p values were calculated with an unpaired two-tailed student’s t-test, scale bar represents 24 μm. d, Representative images of APOE4/4 iPSC-oligodendroglia following addition of 1 μg/ml Bodipy-cholesterol to cell culture media of live cells, for two hours. Cells were counterstained for markers of the endosome (EEA1), lysosome (LAMP1), and endoplasmic reticulum (Calreticulin). The percentage of Bodipy-cholesterol particles overlapping with EEA1, (n = 5), LAMP1 (n = 5), or Calreticulin (n = 4) immunoreactivity was quantified using Imaris software. Scale bar represents 24 μm. Bars represent means, data points represent independent biological replicates, P-values were calculated with a one-way ANOVA.