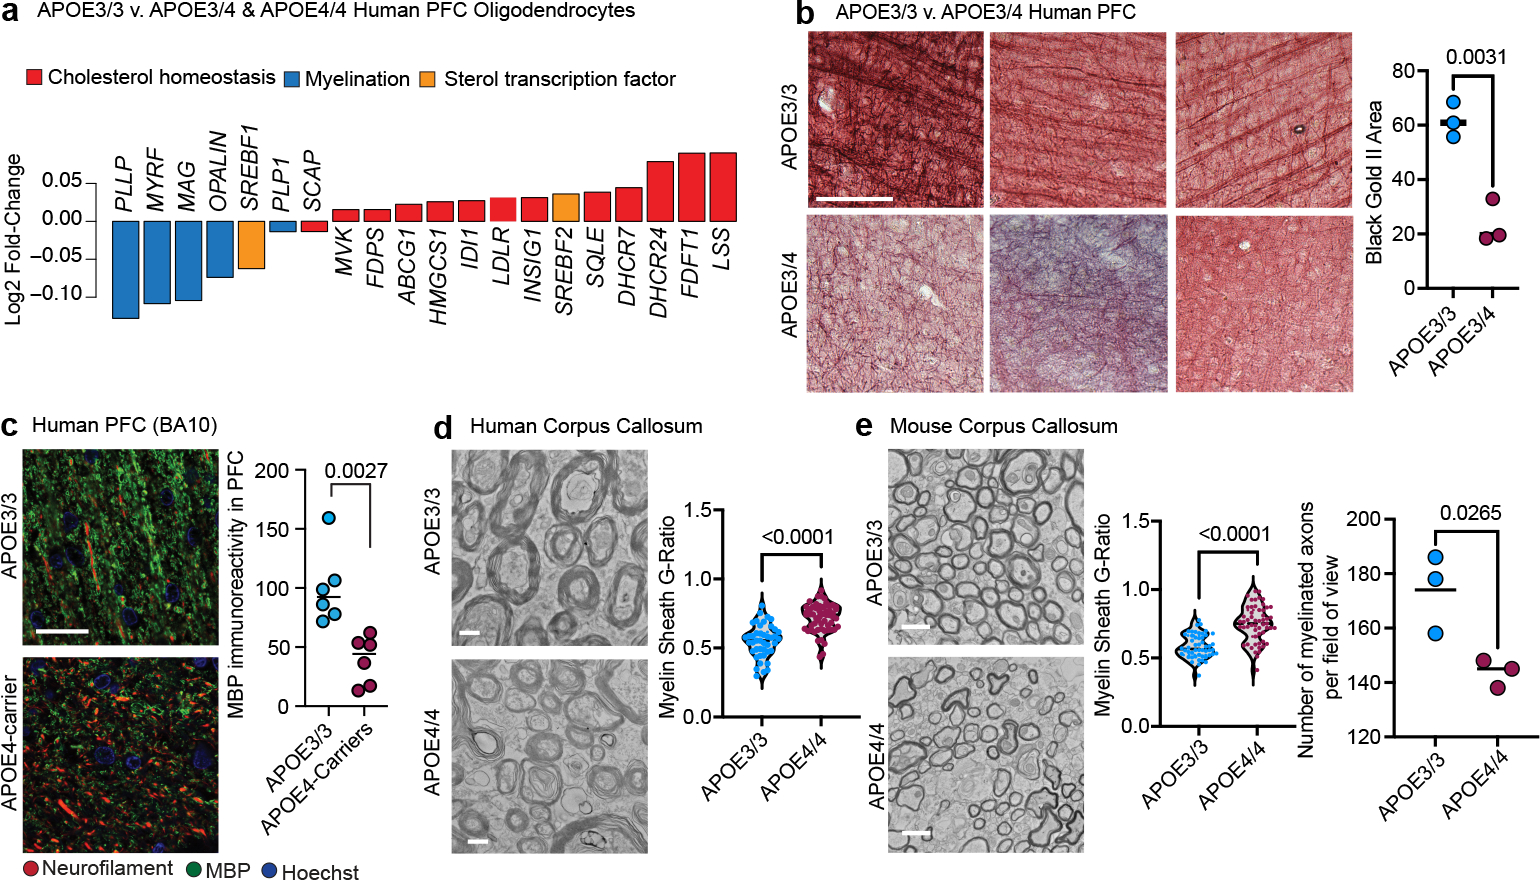
Figure 4: APOE4 leads to impaired myelination in mice and humans.

a, Log2(mean gene expression in APOE3/4 & APOE4/4 / mean gene expression in APOE3/3) for differentially expressed (p-adj < 0.05, Wilcoxon test computed by wilcoxauc(); see methods) myelin-associated or cholesterol-associated genes in human post-mortem oligodendrocytes. b, Black Gold II staining of myelinated axons in the PFC (BA10) of APOE3/3 and APOE3/4 individuals (n=3 individuals/genotype). Area positive for Black Gold II staining was quantified using ImageJ, with same intensity thresholds for each image and group. Scale bar represents 250 μm. Data points represent individuals, bars represent mean per genotype, p values were calculated with an unpaired two-tailed student’s t-test. c, MBP and neurofilament (SMI311) immunoreactivity in prefrontal cortex (BA10) from APOE4-carriers and non-carriers (n=6 individuals/genotype). Area positive for MBP and Neurofilament were quantified using FIJI ImageJ with same intensity thresholds for each image and group. Three images were quantified for each individual. Data points represent individuals mean values, bars represent means per genotype, p values were calculated with an unpaired two-tailed student’s t-test. d, TEM on sections from human corpus callosum of APOE4-carriers (n=3 individuals, n= 58 axons) and APOE3/3 (n=3 individuals, n = 44 axons). Scale bar represents 500 μm. G-ratio was calculated with ImageJ, measuring inner axonal diameter divided by the diameter of outer myelin band. Data points represent axons, p values were calculated with an Wilcoxon test. e, TEM on corpus callosum from APOE3/3 (n=3) and APOE4/4 (n=3) TR mice at 6 months of age. G-ratio was quantified using ImageJ as stated in d). Scale bar represents 500 μm. Data points represent axons, p values were calculated with a Wilcoxon test. Number of myelinated axons per image was counted with Cell Counter tool (ImageJ). Data points represent average per animal, bars represent mean per genotype, p values were calculated with an unpaired two-tailed student’s t-test.
