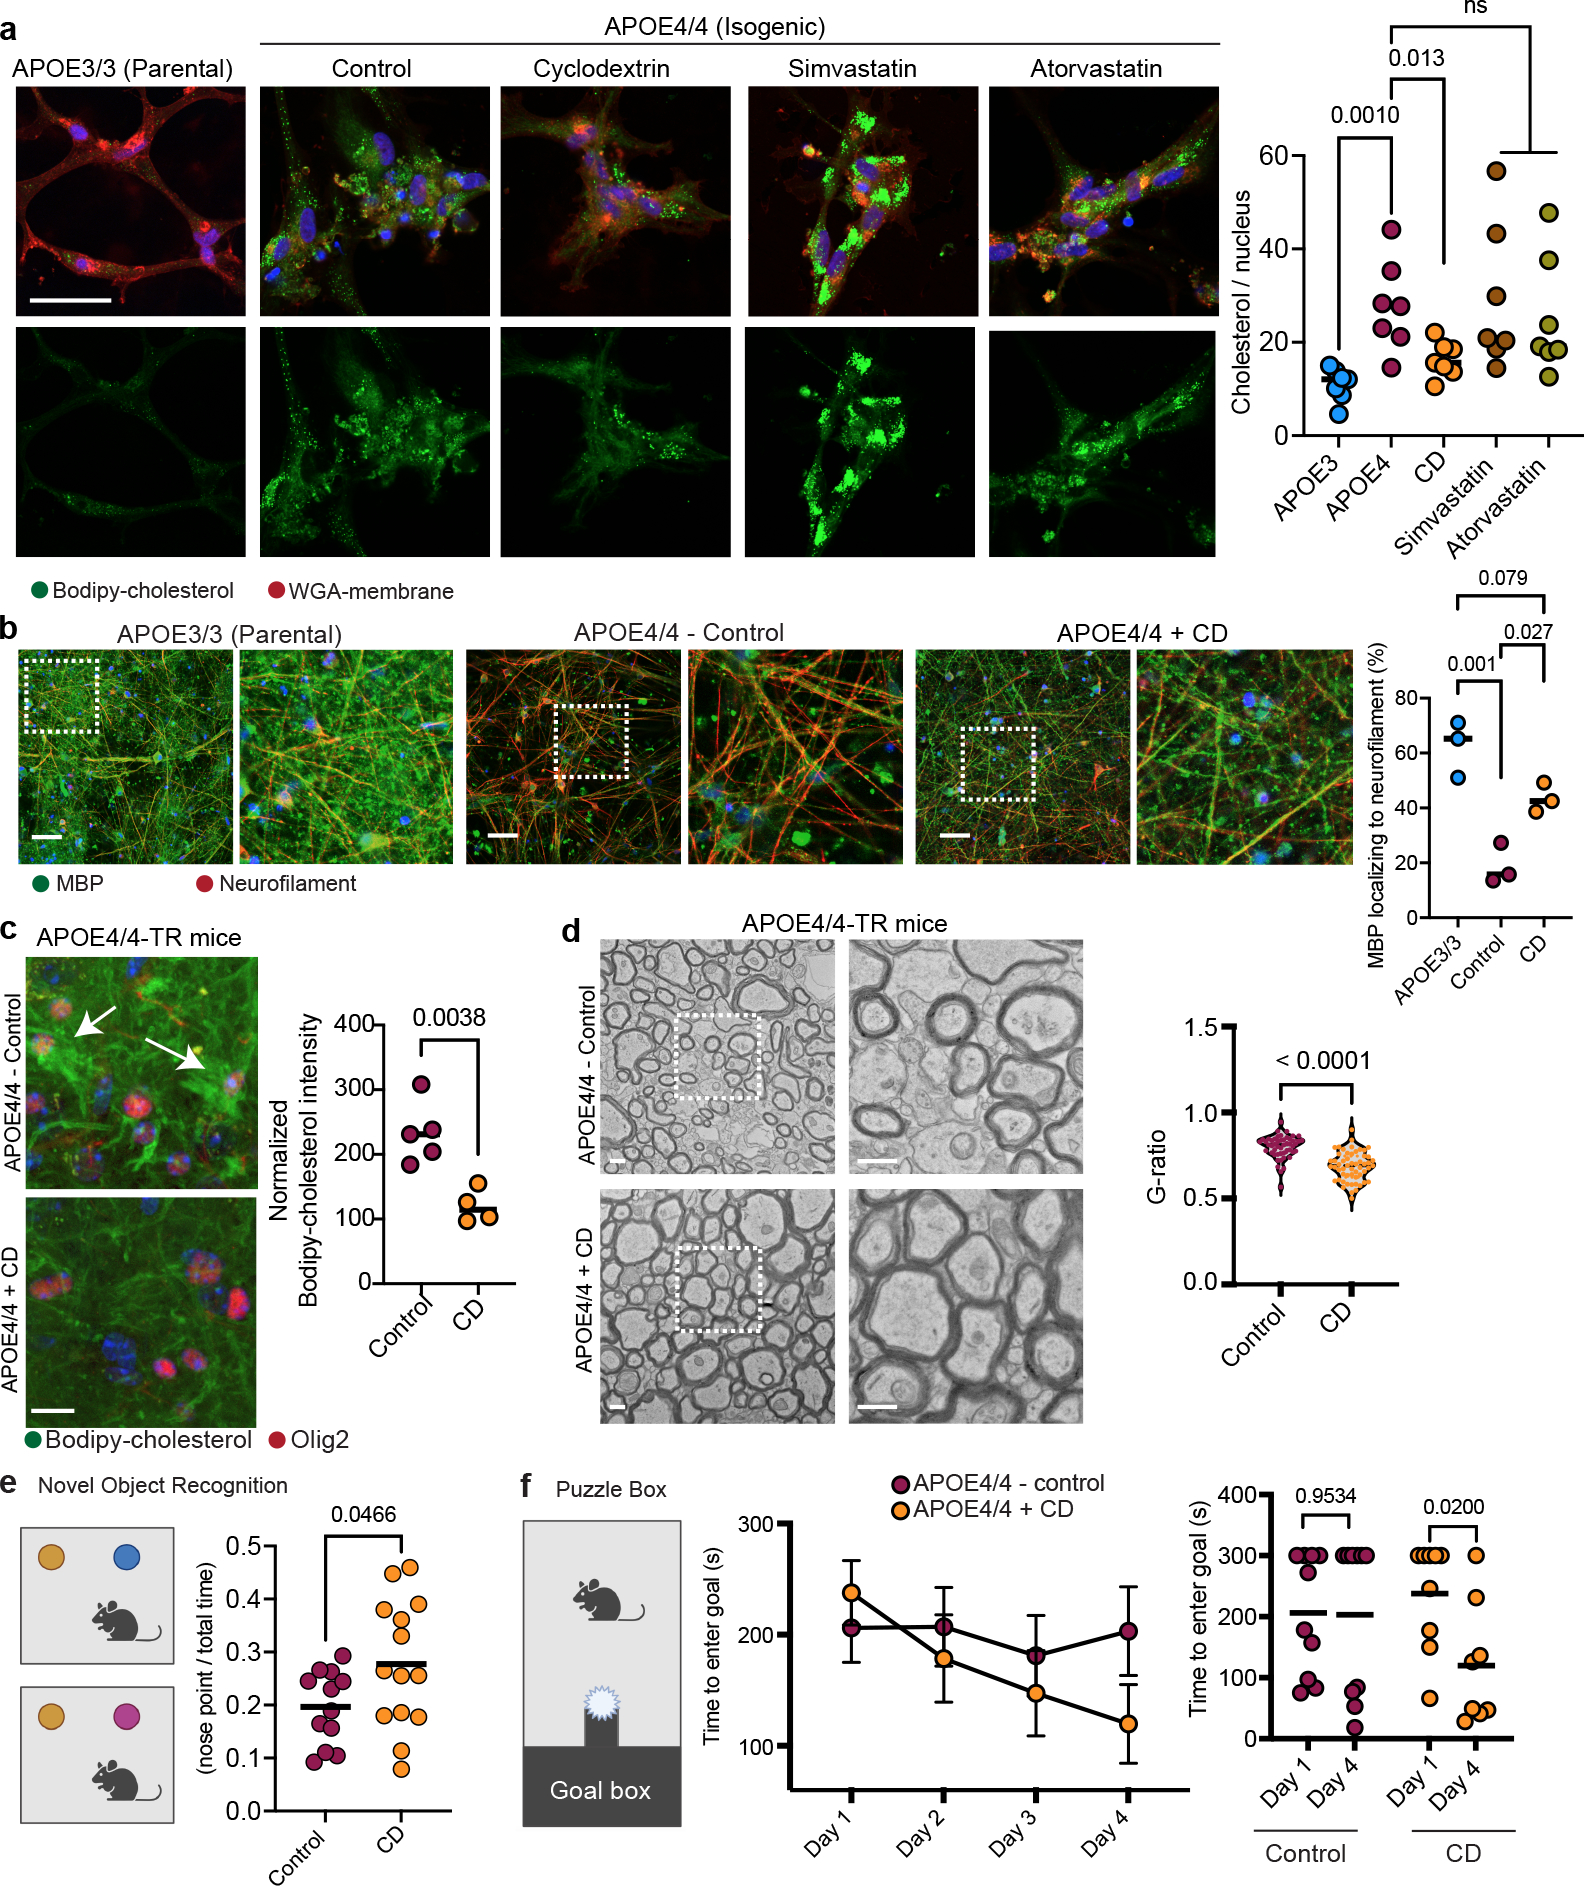
Figure 6: Cyclodextrin improves myelination and learning and memory in aged APOE4 mice.

a, Representative Bodipy-cholesterol images of APOE4/4 iPSC-derived oligodendroglia treated with cyclodextrin (1 mM), simvastatin (1 μM), or atorvastatin (1μM). Scale bar represents 50 μm. Bodipy-cholesterol positive punctae normalized to the number of nuclei. Bars represent means (n=7 biological replicates; p values were calculated using a one-way ANOVA, Bonferroni correction). b, MBP and neurofilament staining of cyclodextrin-treated co-cultures of iPSC-derived APOE4/4 oligodendroglia and neurons versus APOE3/3 co-cultures. Scale bar represents 10 μm. Axonal MBP expression was quantified using Imaris. Bars represent means (n= 3 biological replicates; p values were calculated using a one-way ANOVA, Bonferroni correction). c, Bodipy-cholesterol and Olig2 staining in control (n = 5) or cyclodextrin-treated (n = 4) APOE4/4-TR mouse brain. Arrows highlight Bodipy-cholesterol accumulations around Olig2-positive nuclei. Datapoints represent individual mice, bars represent means of treatment group, p values were calculated with an unpaired two-tailed student’s t-test. Scale bar represents 50 μm. d, Representative corpus callosum TEM images from APOE4/4-TR mice treated with saline (n = 5 mice, n = 51 axons ) cyclodextrin (n = 4 mice, n = 56 axons) for 8 weeks. Scale bar represents 500 nm. G-ratio calculated as described in 4d), p values were calculated with an unpaired two-tailed student’s t-test. e, Schematic of novel object recognition task with control (n = 12) and cyclodextrin-treated (n = 14) APOE4/4-TR female mice. Preference calculated by dividing time the animal explored the novel object with the nose by total time interacting with either object (measured with Noldus EthoVision) Cartoons generated with BioRender. Data points represent individual mice. Bars represent means), p values were calculated with an unpaired two-tailed student’s t-test with Welch correction. f, Puzzle box test, control n = 9 and cyclodextrin-treated n = 10 APOE4/4-TR mice. Task performance was recorded with Noldus EthoVision. Data points represent means per treatment group and bars represent standard error of the mean, p values were calculated with an unpaired two-tailed student’s t-test Cartoons generated with BioRender.
