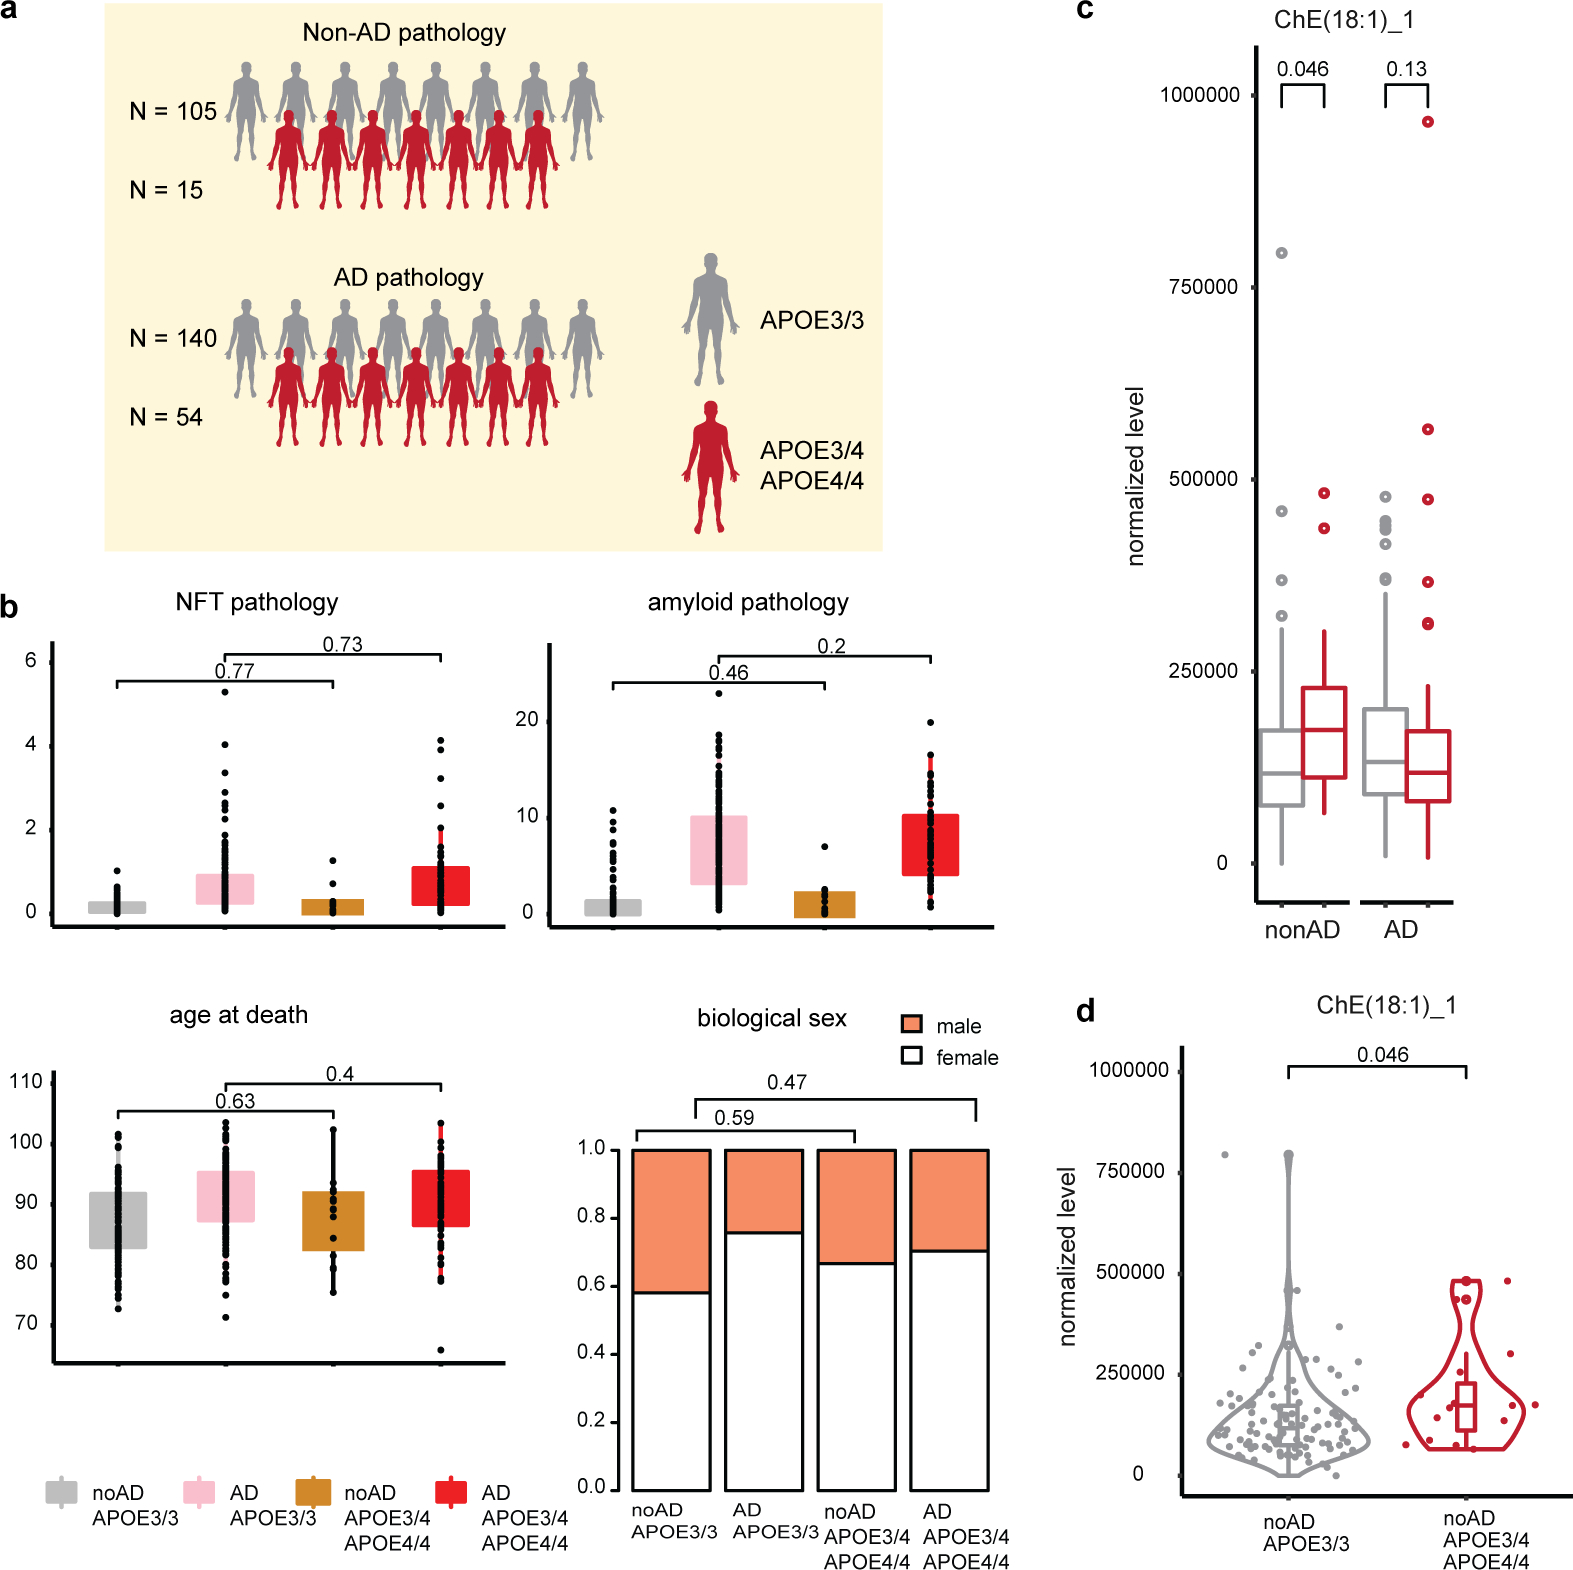
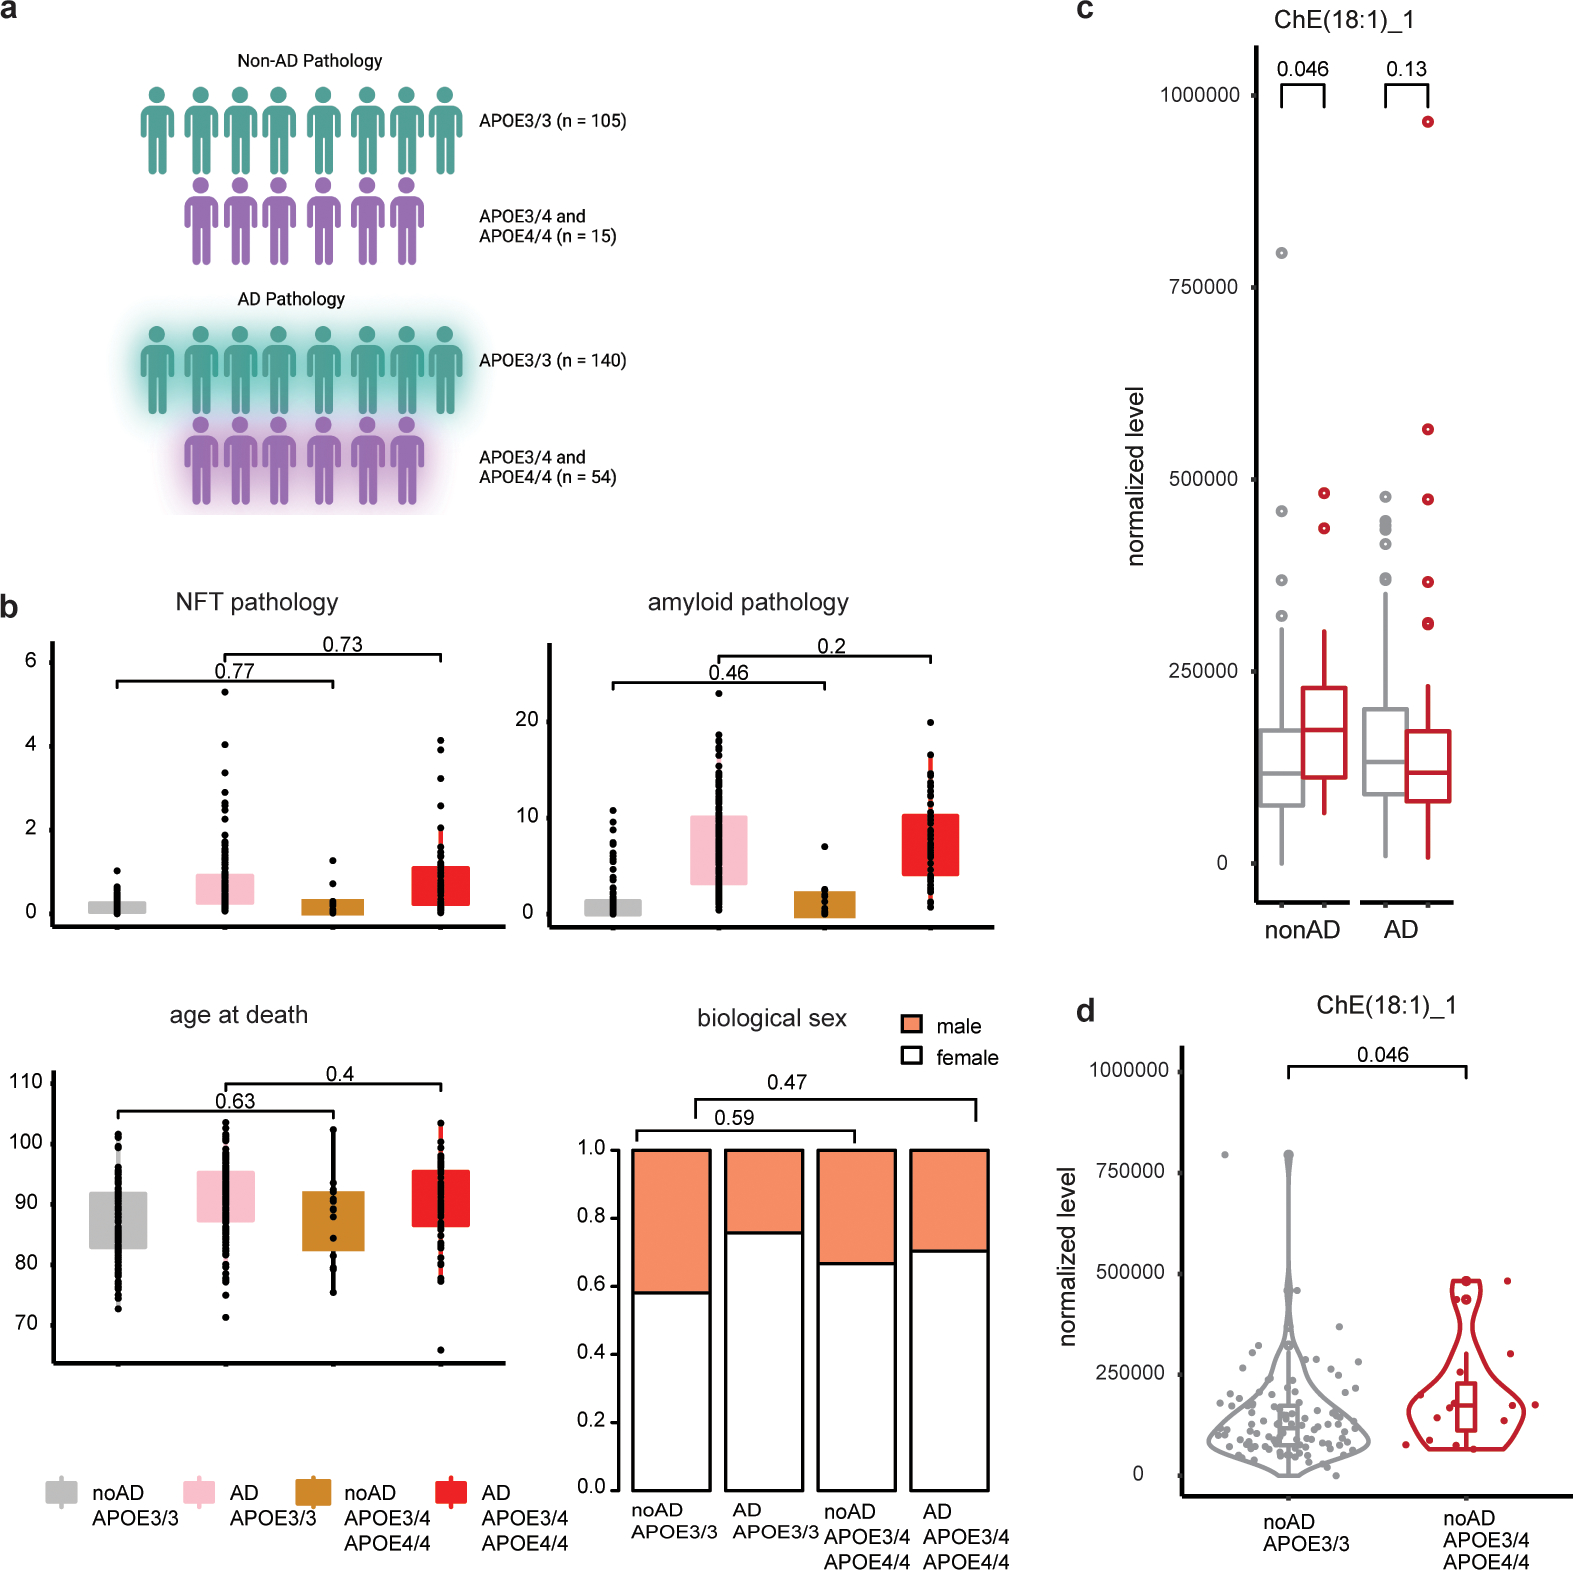
Extended Data Fig. 3: Large-scale lipidomic analysis of human prefrontal cortex.


a, Overview of ROSMAP cohorts on which lipidomic analysis was performed. Cartoons generated with BioRender b, Cohort clinicopathological characteristics. NFT = neurofibrillary tangles (p values calculated with Wilcoxon rank-sum test, two-sided). c, A single cholesterol ester (ChE) species passed quality control (see Methods) and showed significant (p<0.05, Wilcoxon rank-sum test, two-sided) differential concentration when comparing APOE3/3 vs APOE3/4 and APOE4/4-carriers stratified by pathology. ChE(18:1) indicates a ChE with carboxylate position 18 and one unsaturated fatty acid bond. d, Distribution of the concentration of ChE species from c) (p-value = 0.046, Wilcoxon rank-sum test, two-sided). Boxplots indicate median, 25th and 75th percentiles.
