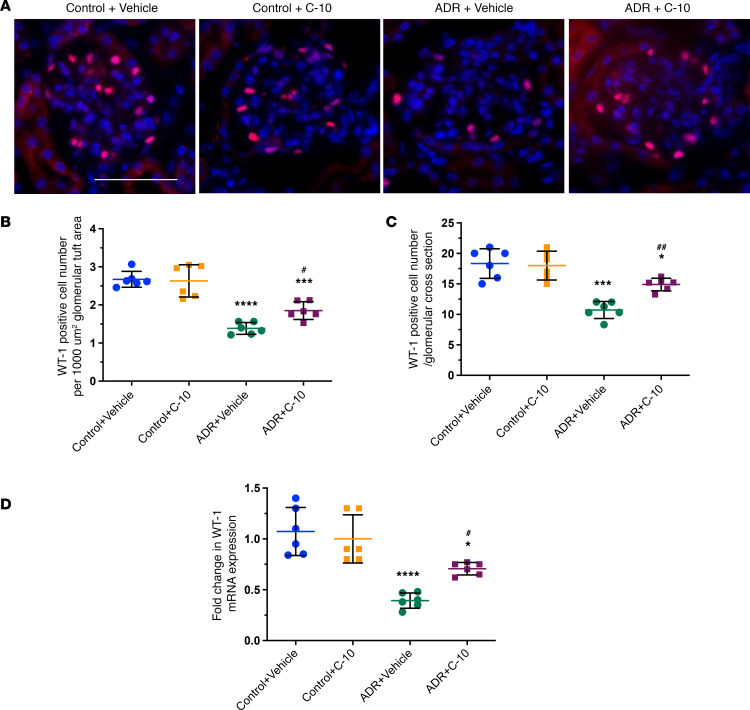
Figure 4. C-10 ameliorates podocyte loss in mice with ADRN.
(A) Representative images of WT-1 staining in glomeruli are shown (n = 6). Original magnification, ×400. Scale bar: 50 μm. (B and C) WT-1–positive cell number per 1000 μm2 glomerular tuft area (B) and per glomerular cross section (C) were quantified and are expressed as fold changes relative to control mice (60 glomeruli quantified per group). (D) mRNA levels of Wt1 were determined using real-time PCR (n = 6 mice per group). *P < 0.05, ***P < 0.001, ****P < 0.0001 compared with control group; #P < 0.05, ##P < 0.01 compared with ADR+Vehicle mice by 1-way ANOVA with Bonferroni’s correction.

