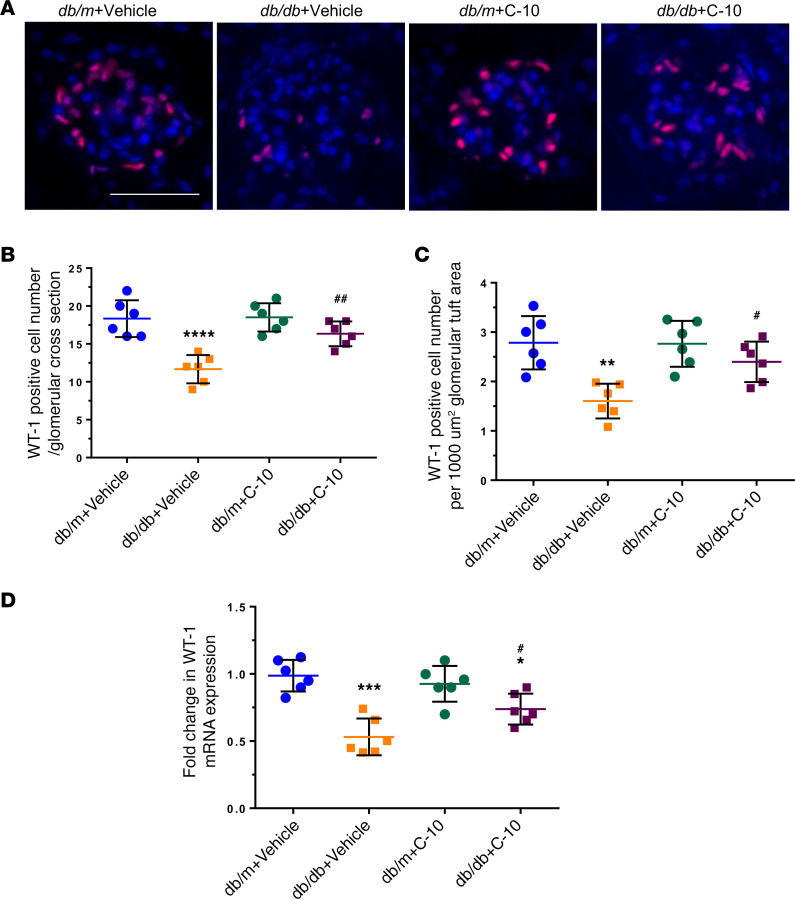
Figure 6. C-10 ameliorates podocyte loss in diabetic mice.
(A) Representative images of WT-1 staining in glomeruli are shown (n = 6). Original magnification, ×400. Scale bar: 50 μm. (B and C) WT-1–positive cell numbers per 1000 μm2 glomerular tuft area (B) and per glomerular cross section (C) were quantified and are expressed as fold changes relative to control db/m mice (60 glomeruli quantified per group). (D) mRNA levels of Wt1 were determined using real-time PCR (n = 6 mice per group). *P < 0.05, **P < 0.01, ***P < 0.001, ****P < 0.0001 compared with control db/m group; #P < 0.05, ##P < 0.01 compared with db/db+Vehicle mice by 1-way ANOVA with Bonferroni’s correction.

