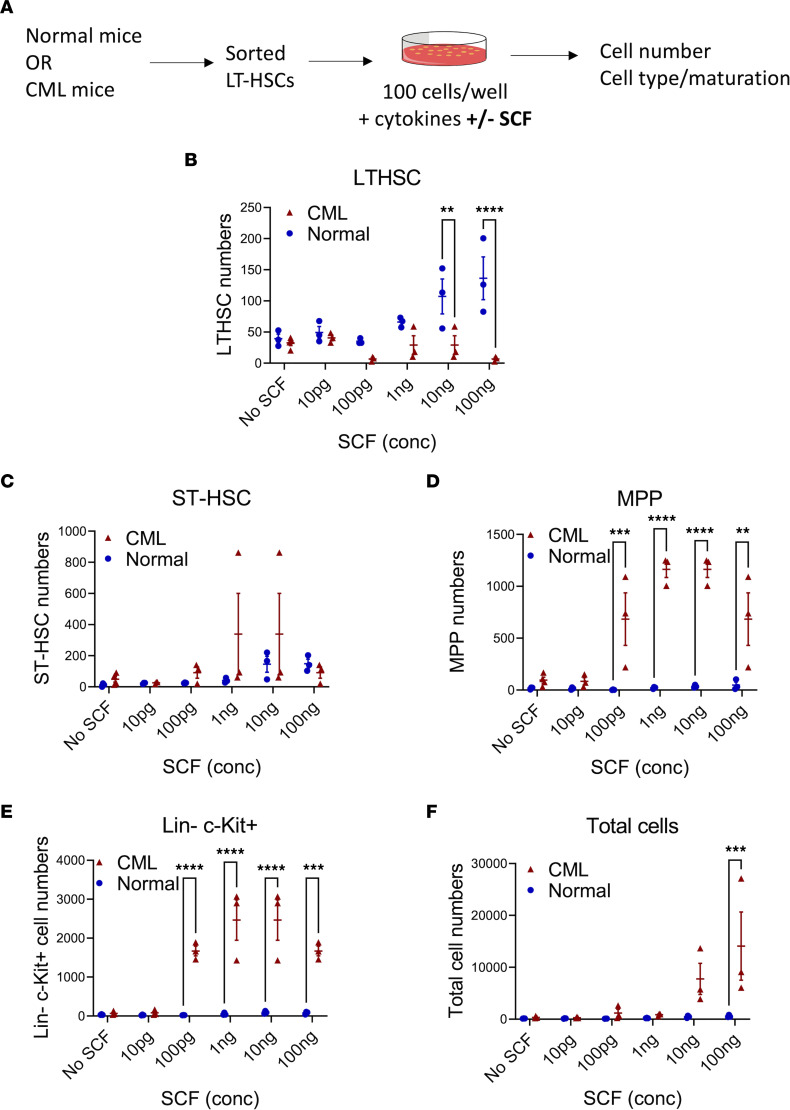
Figure 4. Differential response of normal and CML LT-HSCs to SCF.
Experimental design: LT-HSCs isolated from normal and CML mice by flow cytometry were cultured with varying concentrations of SCF (10 pg to 100 ng) and cell numbers and cell phenotypes analyzed by flow cytometry (A). Number of cells with LT-HSC (B), ST-HSC (C), MPP (D), and LSK (E) phenotype, and total number of cells (F), generated from normal and CML LT-HSCs cultured for 6 days with increasing SCF concentrations. Normal n = 3 from 3–5 mice; CML n = 3 from 3–5 mice. Data represented as mean ± SEM, **P < 0.01, ***P < 0.001, ****P < 0.0001, based on 2-way ANOVA with Holm-Šídák test.

