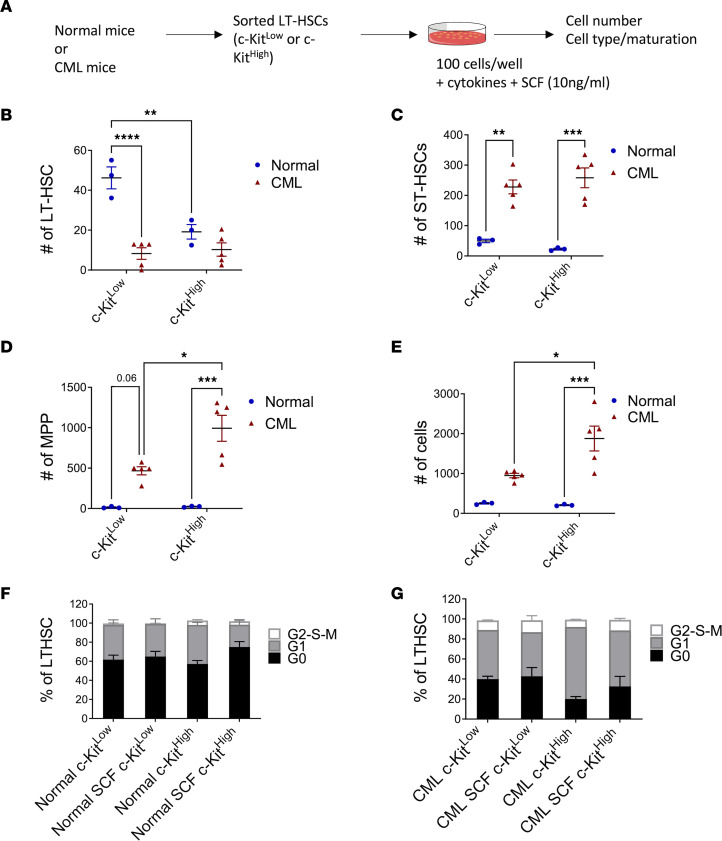
Figure 5. Differential response of c-KITlo normal and CML LT-HSCs to SCF.
Experimental plan: c-KITlo and c-KIThi LT-HSCs isolated from normal and CML mice by flow cytometry were cultured with SCF (10 ng) and cell numbers and cell phenotypes analyzed by flow cytometry (A). Number of cells with LT-HSC (B), ST-HSC (C), or MPP (D) phenotype, and total number of cells (E), generated from normal and CML c-KITlo and c-KIThi LT-HSCs cultured with 10 ng SCF for 10 days (normal, n = 3, and CML, n = 5). Cell cycle analysis showing percentage of G0, G1, and S-G2-M phase normal (F) and CML (G) c-KITlo and c-KIThi LT-HSCs after culture for 24 hours in medium with and without SCF (n = 4 each). Data represented as mean ± SEM, *P < 0.05; **P < 0.01; ***P < 0.001; ****P < 0.0001, based on 2-way ANOVA with Tukey’s test.

