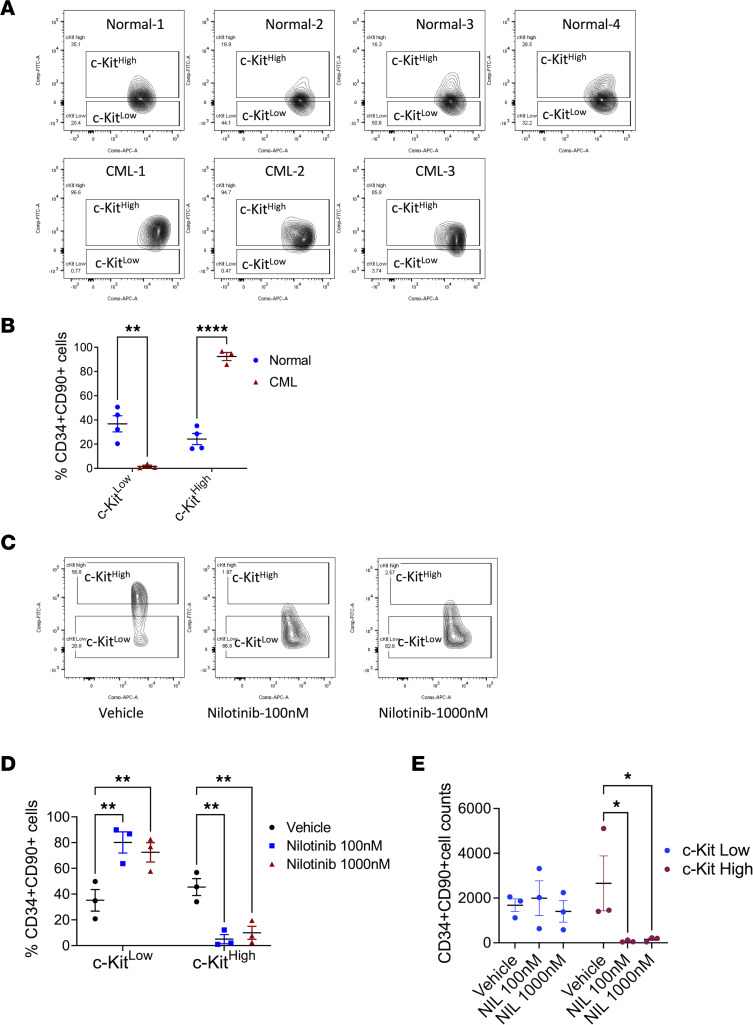
Figure 8. Effect of TKI treatment on human CML c-KITlo LT-HSCs.
CD34+ cells from BM from patients with CML (n = 3) and healthy individuals (n = 4) were analyzed by flow cytometry, and LT-HSCs (CD34+CD38–CD90+) with high c-KIT expression (top 30%, c-KIThi) and low c-KIT expression (bottom 30%, c-KITlo) were identified, following the scheme used in Figure 1. Flow plots showing c-KIT expression in LT-HSCs are shown (A) with compiled data (B). CML CD34+ cells were cultured for 7 days in vitro without TKI (vehicle) or with nilotinib 100 nM and 1,000 nM and CD34+CD90+ cells were analyzed. Flow plots showing c-KIT expression are shown in C and compiled data for the proportion of c-KITlo and c-KIThi CD34+CD90+ cells in D and for number of c-KITlo and c-KIThi CD34+CD90+ cells in E. Data represented as mean ± SEM, *P < 0.05, **P < 0.01, ****P < 0.0001, based on 2-way ANOVA with Tukey’s test.

