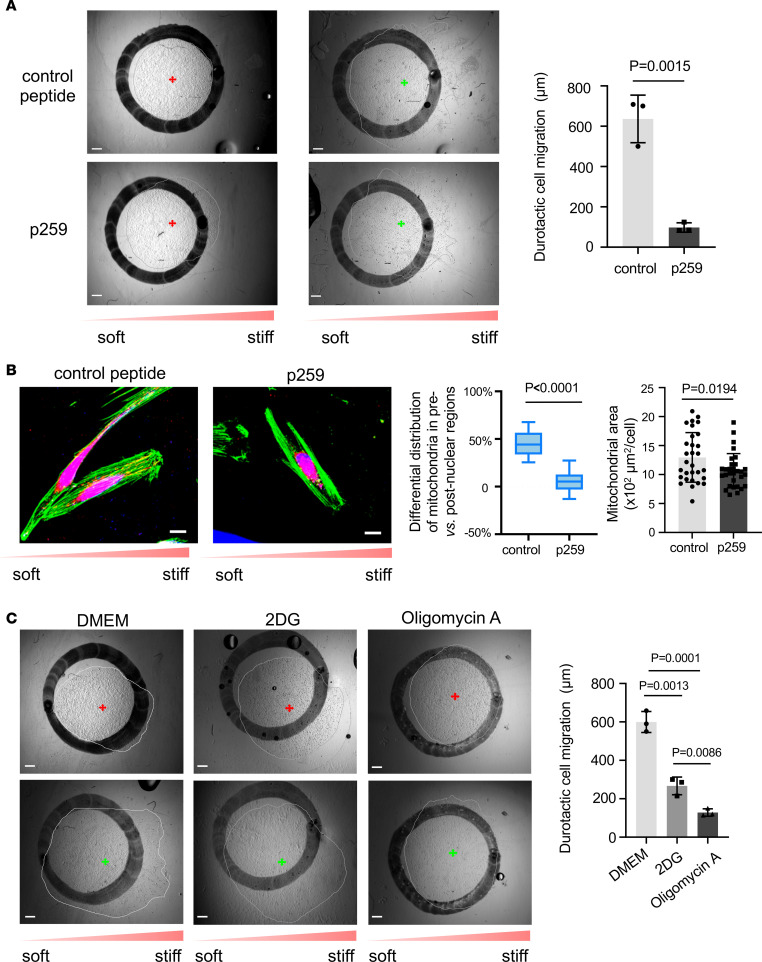
Figure 4. Mitochondrial fission and bioenergetics mediate human lung fibroblast durotaxis.
(A) Human lung fibroblasts were cultured on stiffness gradient gels in the presence of P259 or TAT carrier control peptides. Durotactic cell migration was determined as described in Figure 3. Bar graphs represent mean ± SD of 3 separate experiments. Similar results were obtained from 3 lung fibroblast isolates. A 2-tailed Student’s t test was used for comparison between groups. Scale bar = 500 μm. (B) Mitochondria and actin filaments were stained by MitoTracker (red) and phalloidin (green). Mitochondrial distribution and area were determined as described previously. Results are the means ± SD from 30 individual cells derived from 3 human participants (n = 10 cells per participant) under each condition. Box plots show the interquartile range (box), median (line), and minimum and maximum (whiskers). Statistical analysis was performed by 1-way ANOVA. Scale bar = 20 μm. (C) Human lung fibroblasts were cultured on stiffness gradient gels in the presence or absence of 2-DG or oligomycin A. Durotactic cell migration was determined as described previously. Bar graphs represent mean ± SD of 3 separate experiments. Similar results were obtained from 3 lung fibroblast isolates. Statistical analysis was performed by 1-way ANOVA. Scale bar = 500 μm.

