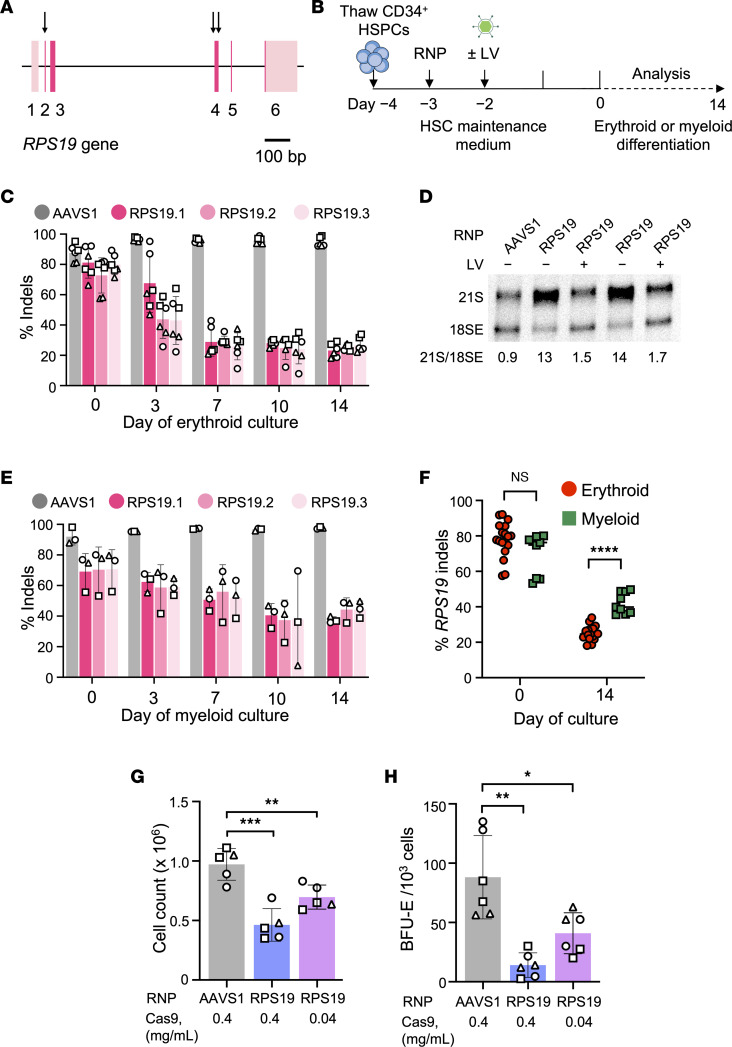
Figure 1. Cas9 disruption of the RPS19 gene in CD34+ HSPCs.
(A) Diagram of RPS19, including exons 1–6, with coding regions in a darker shade. Arrows show regions targeted by 3 single-guide RNAs (sgRNAs). (B) Experimental protocol for the in vitro studies in Figures 1–3. On day −3, healthy donor CD34+ HSPCs were edited by electroporation with ribonucleoprotein (RNP) complex consisting of Cas9-3×NLS plus sgRNAs targeting AAVS1 (as a control) or RPS19. In some experiments, cells were transduced with an RPS19-expressing or control lentiviral vector (LV) on day −2. The frequency of on-target insertion-deletion (indel) mutations was determined by next-generation sequencing (NGS) on day 0, and cells were switched to medium containing cytokines for erythroid (EPO, SCF, IL-3) or myeloid (SCF, TPO, G-CSF, GM-CSF) differentiation. (C) Indel frequency versus time in erythroid medium. (D) Northern blot analysis of RNA from gene-edited HSPCs using ITS1 probe. (E) Indel frequency versus time in myeloid medium. (F) RPS19 indel frequency on days 0 and 14 of erythroid and myeloid culture, from C and E. Data represent a total of 18 experiments for erythroid differentiation and 9 experiments for myeloid differentiation, using 3 different sgRNAs and 3 different CD34+ cell donors. (G) CD34+ HSPCs (1 × 10⁶) were edited with 0.4 or 0.04 mg/mL RNP (Cas9 component) containing AAVS1 or RPS19.1 sgRNA. Three days later (day 0), live cells were quantified with a NucleoCounter NC-200 automated cytometer (ChemoMetec). (H) Burst-forming unit–erythroid (BFU-E) colonies per 1000 CD34+ HSPCs. All bar charts show the data as the mean ± SD, with each symbol representing data from different CD34+ cell donors. *P < 0.05; **P < 0.01; ***P < 0.001; ****P < 0.0001 (unpaired, 2-tailed Student’s t test). P values were adjusted for multiple comparison in F, G, and H by the Holm-Bonferroni method.

