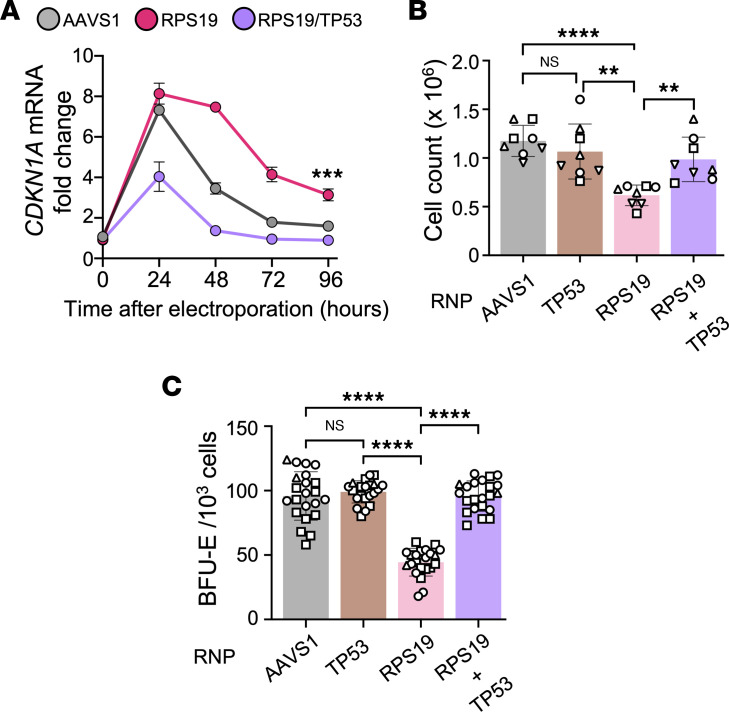
Figure 4. TP53 impairs erythroid development of RPS19+/– HPSCs.
A total of 1 × 10⁶ healthy donor CD34+ HSPCs were edited with RNPs targeting RPS19 and/or TP53 according to the protocol in Figure 1B. (A) Expression level of the TP53 target gene CDKN1A versus time after electroporation, relative to the level in unedited cells. CDKN1 mRNA levels were quantified by RT-ddPCR and normalized to GAPDH. Each data point represents the mean ± SD of 3 biological replicate experiments using CD34+ cells from different donors. Asterisks indicate significant difference between cells treated with RPS19 RNP and AAVS1 RNP. (B) Viable cell counts at 3 days after electroporation. (C) BFU-E colonies per 103 CD34+ HSPCs. Bar charts in B and C show the mean ± SD; each symbol represents a different CD34+ cell donor. **P < 0.01; ***P < 0.001; ****P < 0.0001 by linear mixed-effects model (A) or unpaired, 2-tailed Student’s t test (B and C). P values were adjusted for multiple comparison in B and C by the Holm-Bonferroni method.

