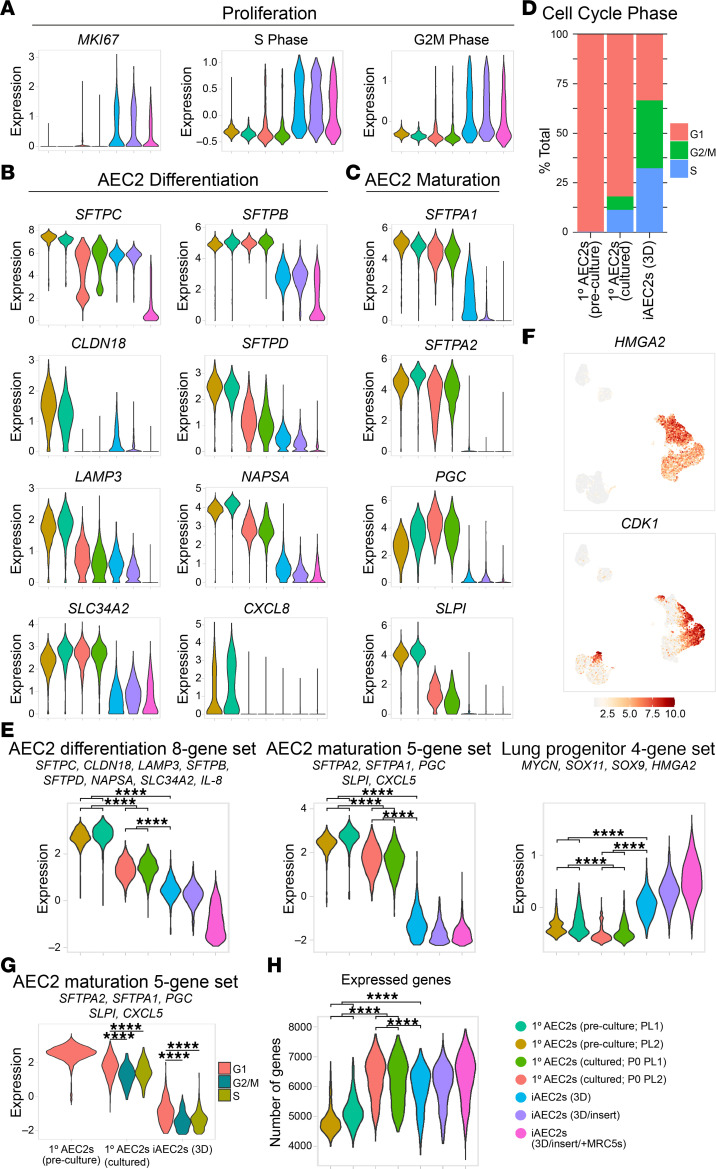
Figure 3. AEC2 maturation is inversely related to proliferation.
(A) Violin plots showing normalized expression for MKI67 and cell cycle phase in preculture 1° AEC2s, cultured 1° AEC2s, and iAEC2s by scRNA-Seq. (B) Violin plots showing normalized expression for individual genes from a published AEC2 differentiation gene set (36). (C) Violin plots showing normalized expression for individual genes from a published maturation gene set (36). (D) Bar plot of cell cycle phase proportions by sample. (E) Violin plots showing normalized expression for indicated gene sets in preculture 1° AEC2s, cultured 1° AEC2s, and iAEC2s by scRNA-Seq. (F) Normalized gene expression overlaid on UMAP plots for the indicated transcripts. (G) Violin plots of AEC2 maturation gene set by cell cycle phase in preculture 1° AEC2s, cultured 1° AEC2s, and iAEC2s. (H) Violin plots of expressed genes in preculture 1° AEC2s, cultured 1° AEC2s, and iAEC2s by scRNA-Seq. ****P < 0.0001 by 1-way ANOVA with Bonferroni correction for multiple comparisons for all panels.

