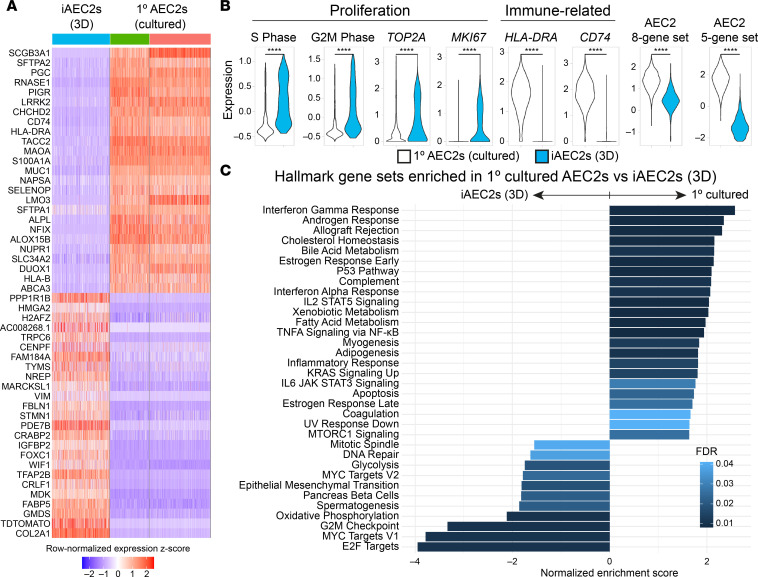
Figure 4. Pairwise single-cell transcriptomic comparisons of 1° cultured AEC2s versus iAEC2s.
(A) Heatmap of top 25 downregulated and top 25 upregulated genes comparing feeder-free iAEC2s to cultured 1° AEC2s by scRNA-Seq (ranked by average log fold change, FDR < 0.05; row-normalized expression z scores). (B) Violin plots showing normalized expression for indicated genes, gene sets, or cell cycle phase in 1° cultured AEC2s versus iAEC2s by scRNA-Seq. ****P < 0.0001 by unpaired, 2-tailed Student’s t test. (C) Gene set enrichment analysis (GSEA, camera using Hallmark gene sets) of differentially regulated gene sets in cultured 1° AEC2s versus feeder-free (3D) iAEC2s (FDR < 0.05).

