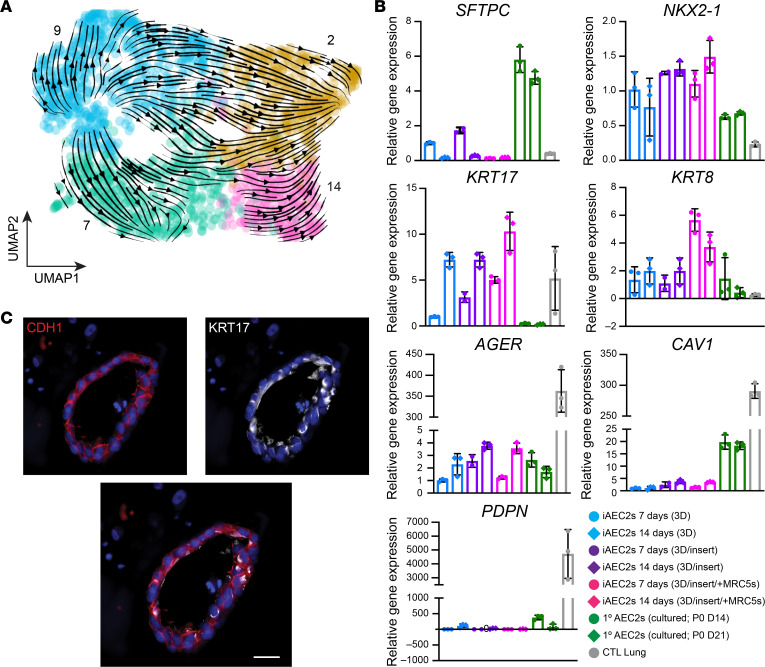
Figure 8. Characterization and kinetics of transitional state marker gene expression.
(A) RNA velocity analysis indicates that cluster 14 cells (enriched in the KRT5–KRT17+ gene set; Figure 7D) arise from iAEC2s over time. (B) RT-qPCR showing fold change in gene expression in the indicated samples compared with iAEC2s cultured in feeder-free conditions for 7 days. Control samples are an adult human distal lung explant (CTL Lung). (C) Representative immunofluorescence microscopy of iAEC2s cocultured with MRC5 fibroblasts and stained for E-cadherin/CDH1 (red), KRT17 (white), and DNA (Hoechst, blue). Scale bars: 25 μm.

