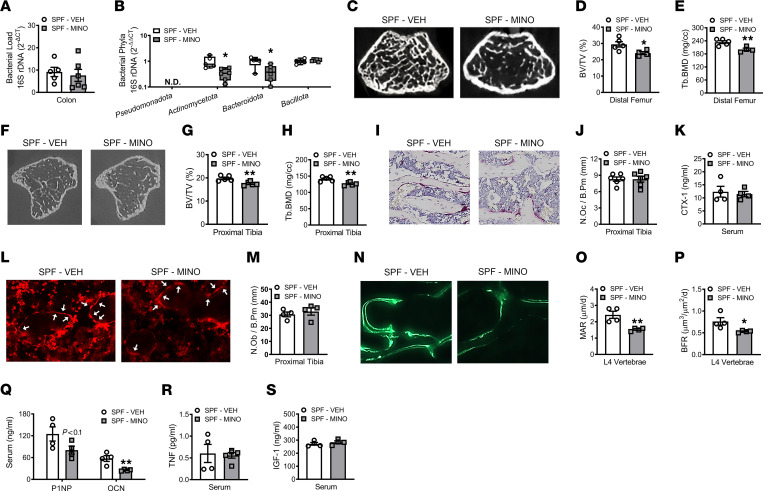
Figure 2. Minocycline therapy during pubertal/postpubertal growth impairs skeletal maturation and suppresses osteoblastogenesis.
Male C57BL/6T specific pathogen–free (SPF) mice were administered vehicle control (VEH) or minocycline (MINO) from age 6 to 12 weeks; euthanized at age 12 weeks. Quantitative real-time PCR (qRT-PCR) 16s rDNA analysis of colonic contents evaluating (A) bacterial load and (B) phyla; n = 5–6/group. (A) Bacterial load determined by normalizing the universal 16S gene to a bacterial DNA standard; quantification by the 2-ΔCT method. (B) Phylum outcomes determined by normalizing phyla genes to the universal 16S gene; quantification via the 2-ΔΔCT method. N.D., not detected. Micro-CT analysis of distal femur trabecular bone; n = 4–5/group: (C) representative images; (D) bone volume per tissue volume (BV/TV); (E) trabecular bone mineral density (Tb.BMD). Micro-CT analysis of proximal tibia trabecular bone; n = 5/group: (F) representative images; (G) BV/TV; (H) Tb.BMD. Histomorphometric analysis of tartrate-resistant acid phosphatase–positive (TRAP+) osteoclasts lining trabecular bone in the proximal tibia; n = 6/group: (I) representative images (original magnification, 200×); (J) number of osteoclasts per bone perimeter (N.Oc/B.Pm). (K) C-terminal telopeptides of type I collagen (CTX-I) serum ELISA; n = 4/group. Immunofluorescence analysis of osteoblasts lining trabecular bone in the proximal tibia. Osterix+ cuboidal bone lining cells were designated osteoblasts (red, osterix–rhodamine); n = 4/group: (L) representative images (original magnification, 200×), arrows indicate osteoblasts; (M) number of osteoblasts per bone perimeter (N.Ob/B.Pm). Dynamic histomorphometric analysis of trabecular bone formation indexes in L4 vertebra; calcein administered 5 and 2 days prior to sacrifice; n = 4/group: (N) representative images (original magnification, 200×); (O) mineral apposition rate (MAR); (P) bone formation rate (BFR). (Q) N-terminal propeptide of type 1 procollagen (P1NP) and osteocalcin (OCN) serum ELISAs; n = 4/group. (R) Tumor necrosis factor (TNF) and (S) insulin-like growth factor 1 (IGF-1) serum ELISAs; n = 4–5/group. Unpaired 2-tailed t test; reported as mean ± SEM; *P < 0.05 versus VEH, **P < 0.01 versus VEH.

