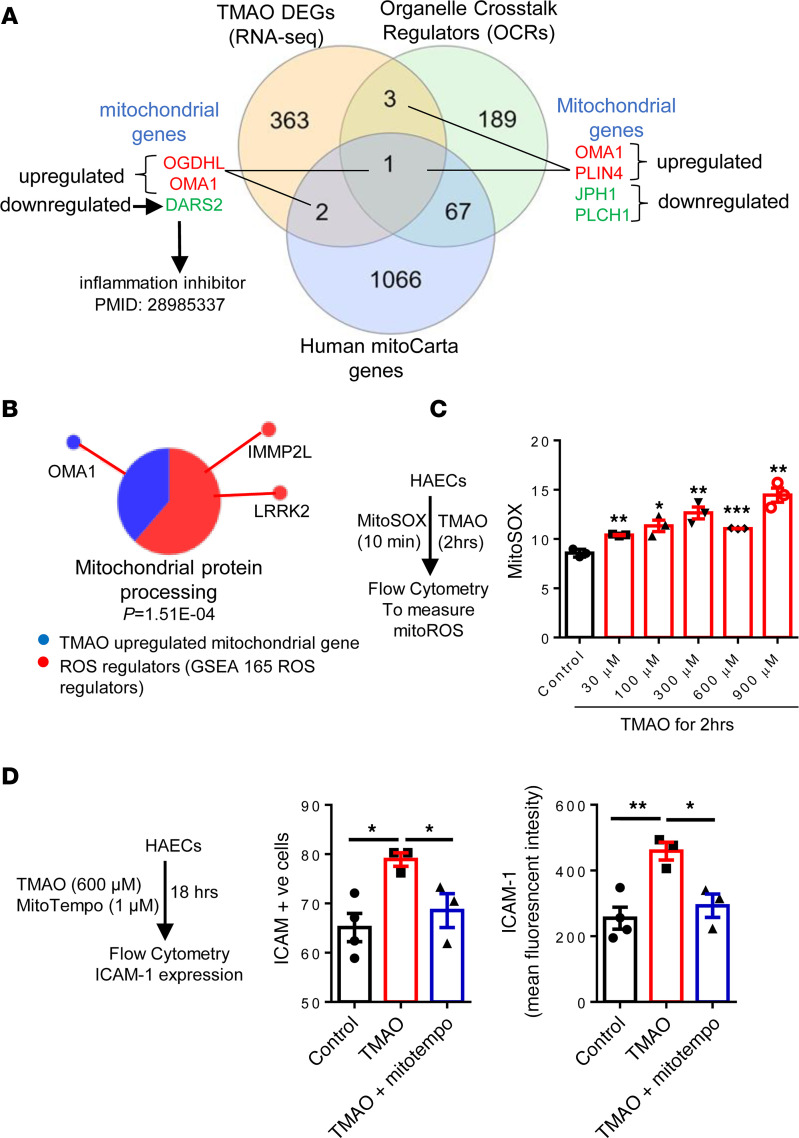
Figure 7. TMAO upregulated PLIN4, OMA1, and OGDHL and downregulated DARS2, and it induced mitoROS and mitoROS inhibitor inhibited TMAO-induced ICAM-1.
(A) RNA-Seq data show that TMAO significantly modulated the expression of 4 organelle crosstalk regulators (OCRs) with 2 upregulated genes, PLIN4 and OMA1, and 2 downregulated genes, JPH1 and PLCH1; TMAO upregulated 2 MitoCarta genes, OGDHL and OMA1, and downregulated DARS2. (B) Cytoscape analysis showed the connection between TMAO-upregulated mitochondrial gene (OMA1) and 2 ROS regulators (GSEA). (C) TMAO induces mitoROS. HAECs were treated with different TMAO concentrations for 2 hours. Then cells were loaded with MitoSOX, and MitoSOX was detected by flow cytometry (n = 3 for each group); the experiment was repeated 3 times. (D) Overproduction of mitoROS contributes to TMAO-induced EC activation. HAECs were treated with TMAO (600 μM) and mitoTempo (1 μM) for 18 hours. ICAM-1+ cell and mean fluorescence intensity (MFI) were detected using flow cytometry analysis (n = 3 for each group; the experiment was repeated 3 times). Data are represented as the mean ± SEM (t test; *P < 0.05, **P < 0.01, ***P < 0.001).

