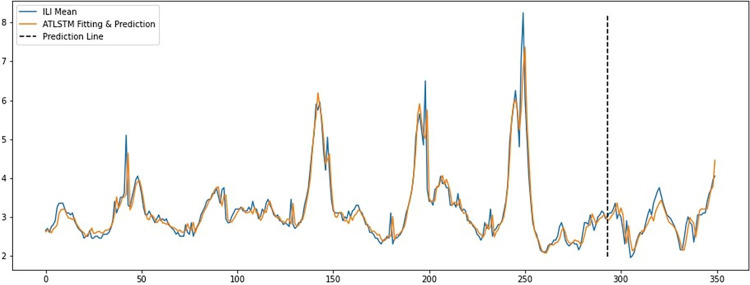
Fig 4. Prediction results of the attention-based LSTM model.
The abscissa of this line chart is the time span (in week unit, containing the last 350 weeks of the whole dataset, from the 52th week of 2015 (December 21th to December 27th), to the 52th week of 2021 (December 27th 2021 to January 2nd 2022)), and the ordinate of this chart is the numerical value of ILI. Since we use the last 57 week of our whole data as the test set, in this chat we draw a dotted line named prediction line to distinguish the time span between training data and test set, which is, the 49th week of 2020 (November 30th to December 6th) to the 52th week of 2021. Same as the Fig 2, in this chart, the real numerical value of ILI mean data through the time span is shown as the blue line, and the algorithm return ILI value by using ATLSTM model in fitting and prediction on the training set and test set respectively in the same time span is shown as the brown line. In this line chart, we can also find a high degree of fitness between the blue line and the brown line, which reveals the characteristics of the real ILI data are well remembered by the ATLSTM by training based on the Baidu index data so it can return a good prediction.

