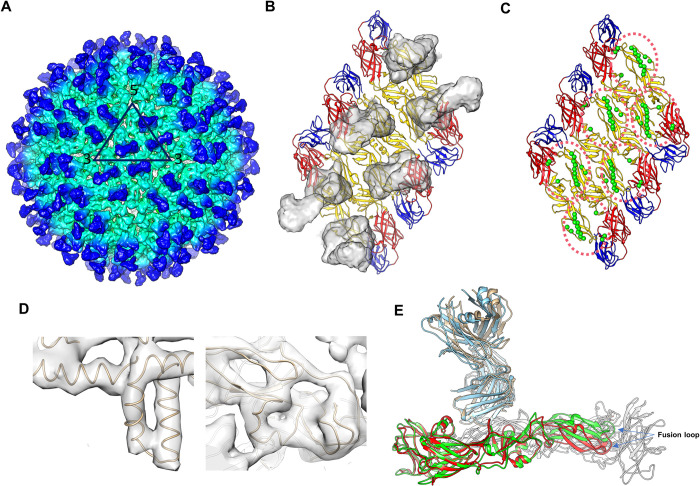
Fig 2. Cryo-EM map of the ZIKV complexed with G9E Fab.
(A) The cryo-EM map of the ZIKV:G9E Fab complex was determined to 5.9 Å resolution. Densities corresponding to the E protein layer and Fabs are colored in cyan and blue, respectively. The black triangle indicates an asymmetric unit and the 5-, 3-, 2-fold vertices are labeled. (B) Densities of Fab molecules displayed on the three E proteins within a raft. The E protein EDI, EDII and EDIII are colored in red, yellow and blue, respectively. (C) Residues forming the G9E epitopes (pink dotted circles) are shown as green spheres. (D) Zoom-in views of the densities of the fitted trans-membrane α-helices (left) and EDII (right). (E) Comparison of the cryo-EM structure with the crystal structure of the soluble E:G9E Fab complex. When G9E Fab is bound to the virus surface, it did not induce structural changes to the E proteins (red). When superimposed onto this structure, the crystal structure shows its EDII domain (green) is elevated to represent the flat conformation of the soluble E protein.

