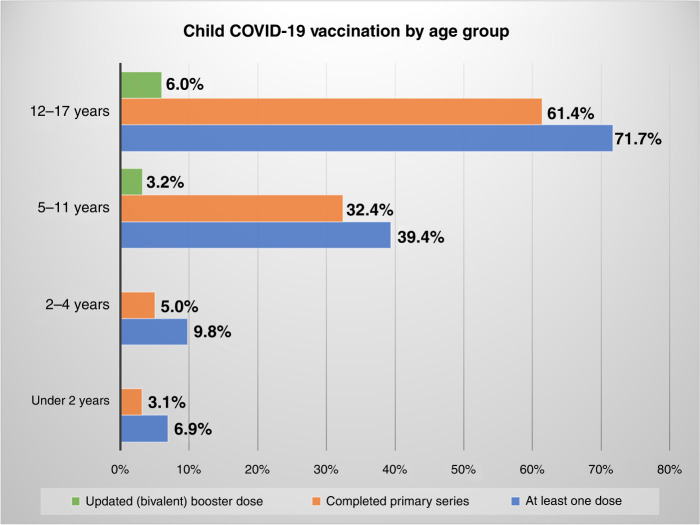
Fig. 1. Child COVID-19 vaccination by age group.
Bar chart of percentage of COVID-19 vaccinations by age group determined by the total count of vaccinations within each age group devided by United States Census Bureau estimates for total population within age each group. The green bar represents the percentage of children who have completed the primary COVID-19 vaccine series and received an updated (bivalent booster dose). The orange bar represents the percentage of children with a completed primary series, defined as those who have received the second dose of the 2 dose COVID-19 vaccine series. The blue bar represents the percentage of children who have received at least one dose of COVID-19 vaccine series.2

