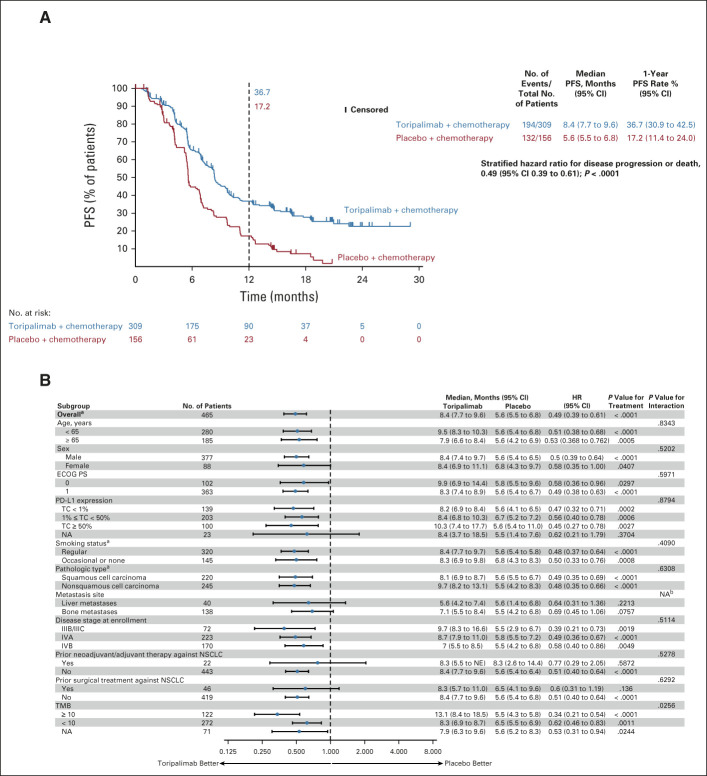
FIG 2.
(A) Kaplan-Meier-estimated PFS curves as assessed by the investigator according to RECIST v1.1 in the intention-to-treat population on the data cutoff date October 31, 2021, are shown to compare the toripalimab plus chemotherapy arm with the placebo plus chemotherapy arm as first-line treatment for patients with advanced NSCLC. Censored patients are marked with “┃” in the graph. Numbers of patients at risk at indicated time points shown below x-axis. Number of events, median PFS, 1-year PFS rates, and stratified HR for PFS are shown to the right of Kaplan-Meier curves. (B) PFS in key subgroups. All HRs were computed using the Cox proportional hazards model. All P values were two-sided with no adjustment of multiplicity. The P values of comparing the Kaplan-Meier curves were computed using the log-rank test stratified by the baseline PD-L1 expression status, histology, and smoking status. The P values of testing the interaction of the subgroup variables with the treatment (B) were computed using the Cox proportional hazards regression model with the treatment arm, the subgroup variable, and their interaction as the covariates. aP values were stratified by the factors used for randomization except the subgroup variable itself. bNA,not applicable due to overlapping metastases to liver and bone. HR, hazard ratio; NA, not available; NSCLC, non–small-cell lung cancer; PD-L1, programmed death ligand-1; PFS, progression-free survival.

