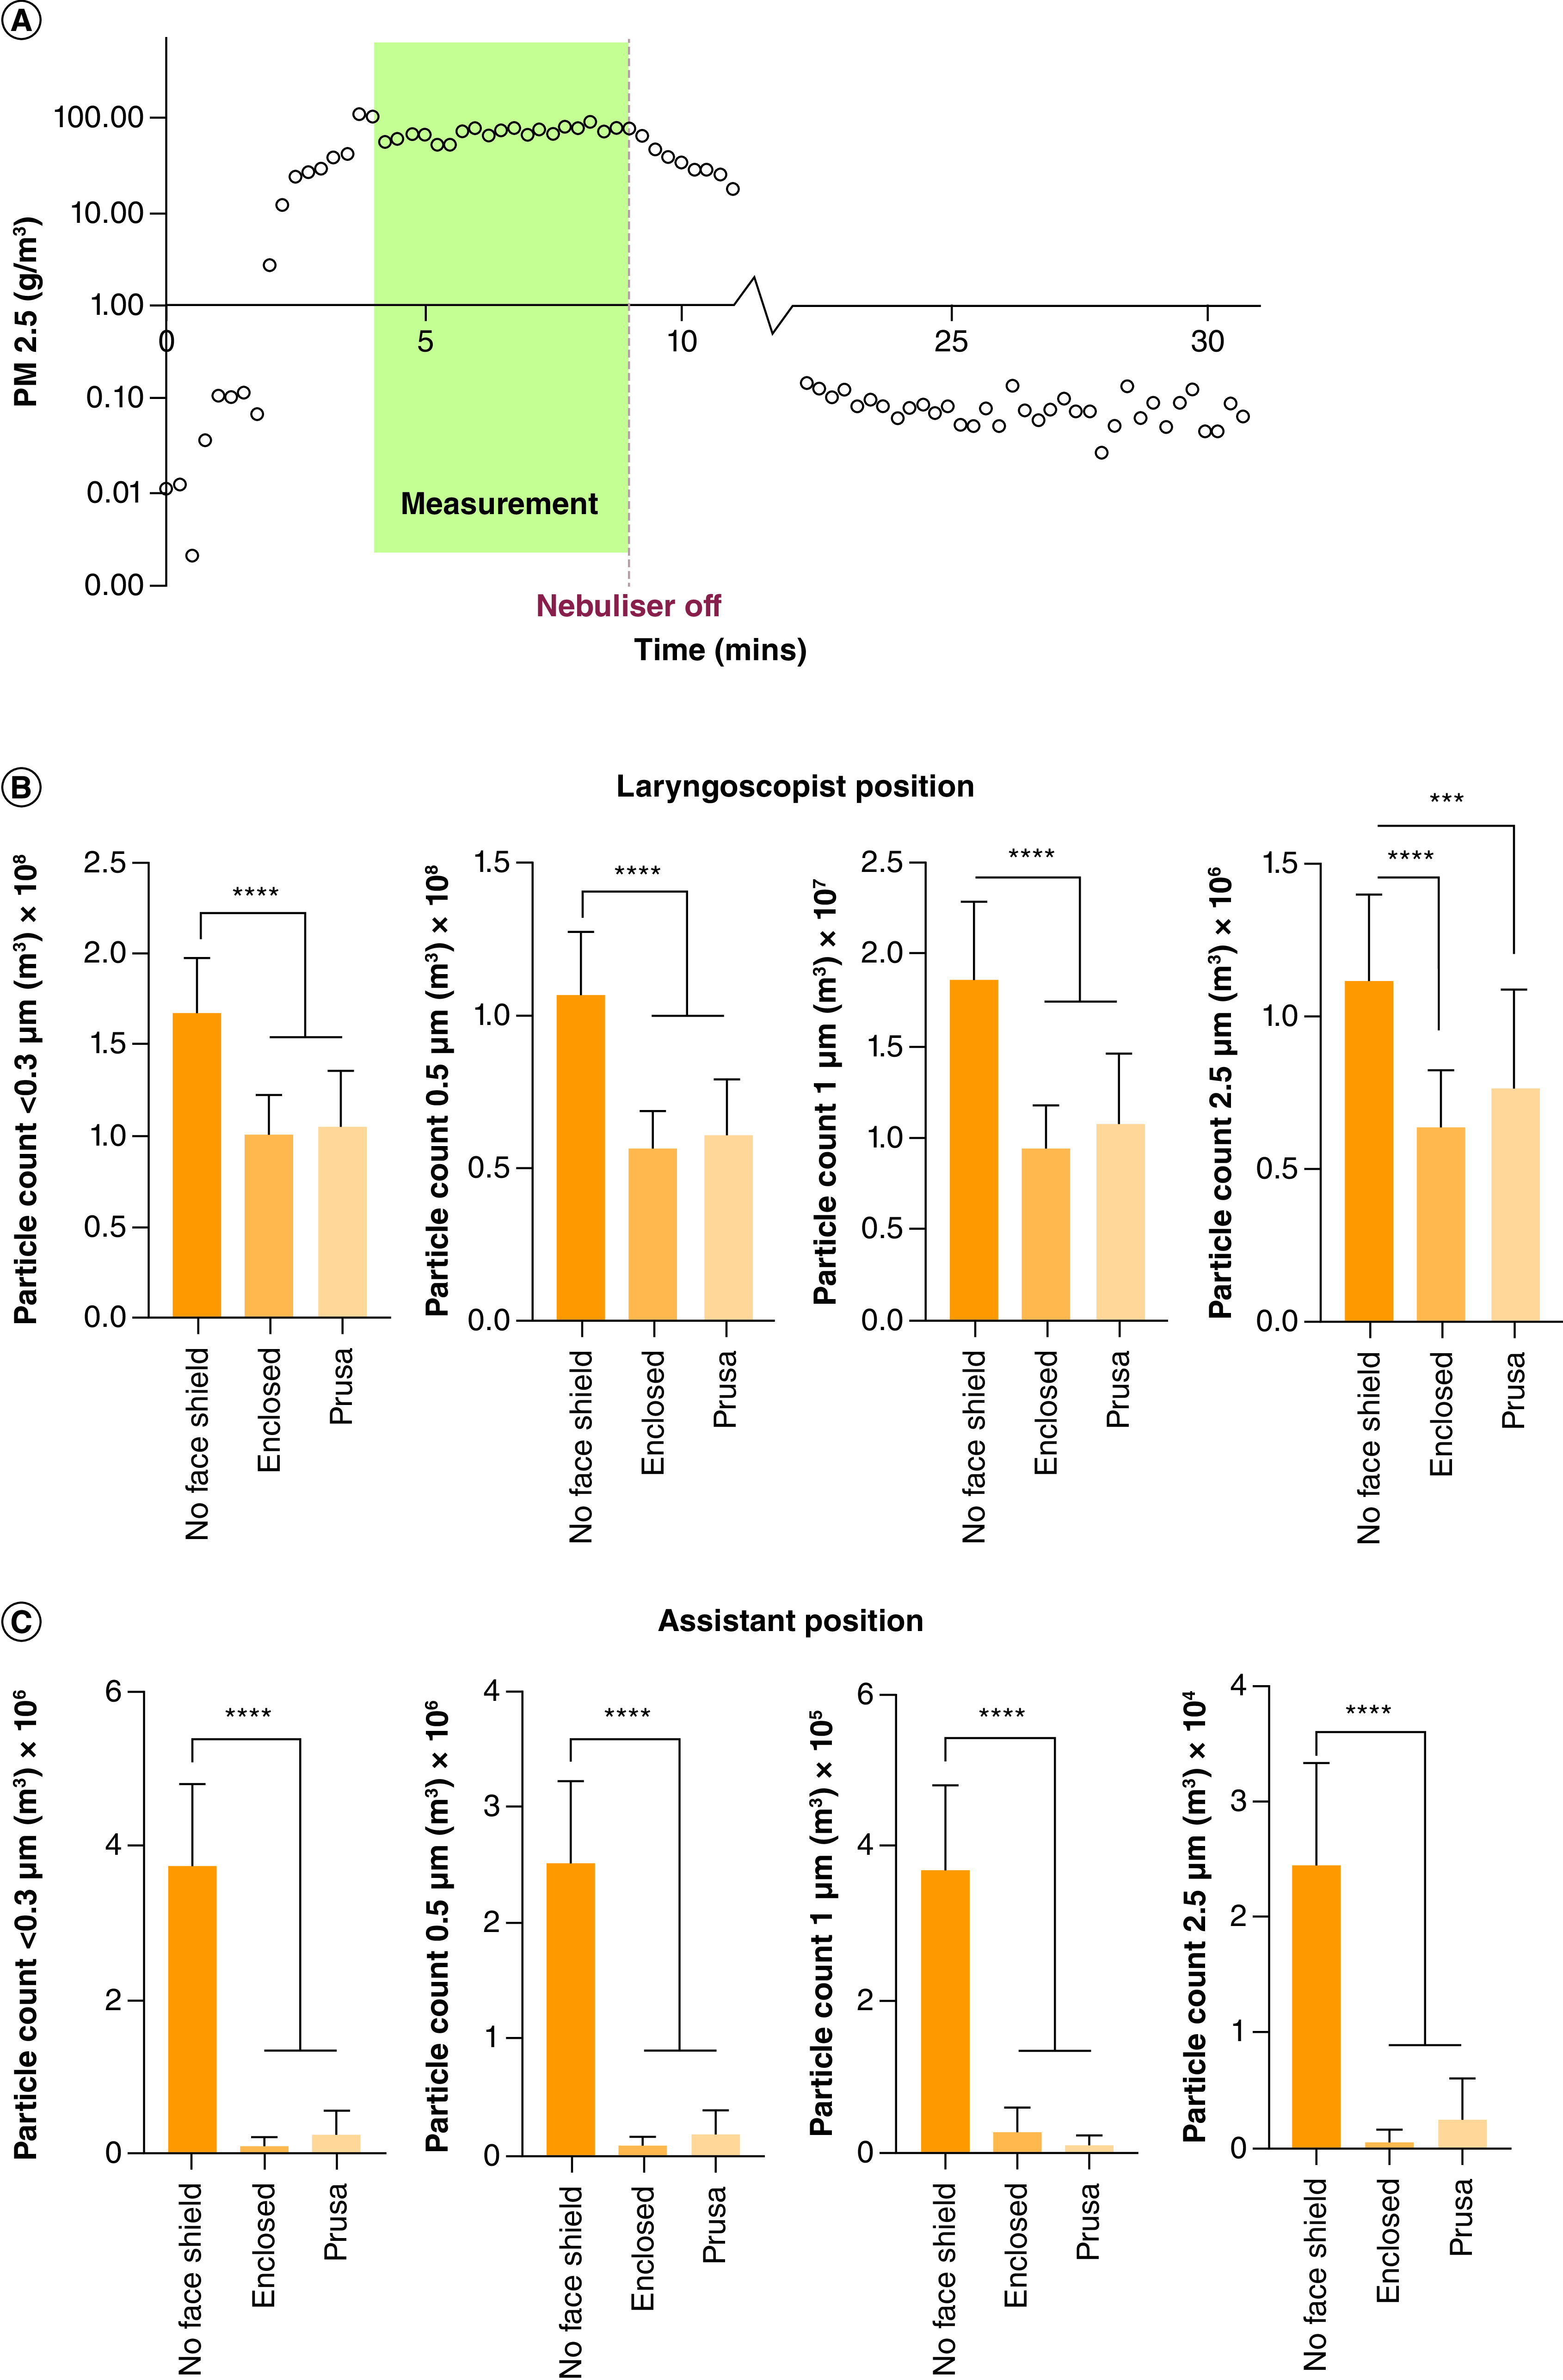
Figure 5. . Results.

(A) Fine particle mass (PM2.5) recorded cumulatively over 15-s intervals at position 1 without a face shield. The readings used for the statistical analysis are indicated in green. Also evident is the ramp-up time, approximately 4 min, and the required rest time of 15–20 min. (B & C) Average number of particles measured at positions 1 and 2.
Y-axis: averaged particle count per cubic meter for each particle size (0.3, 0.5, 1, 2.5 μm).
****p value < 0.0001; ***p value = 0.0003.
