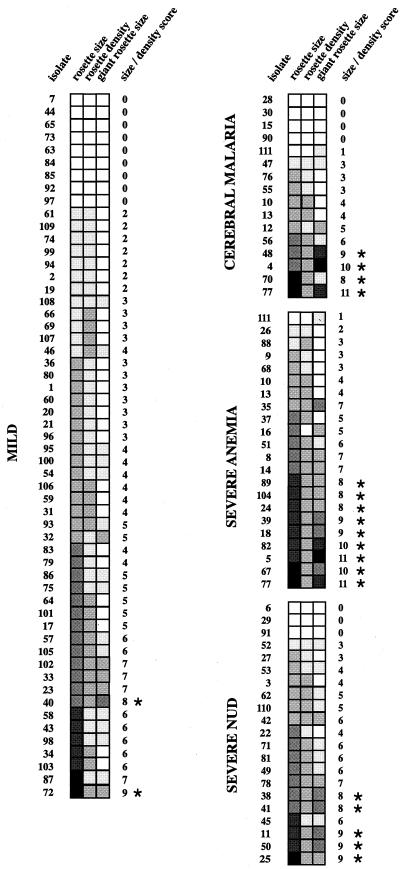
FIG. 3.
Mosaic illustrating the frequency, size, and density of rosettes and the frequency and size of giant rosettes. Squares □, ░, ▒, , ▓, and █ correspond to scores of 0 to 5, respectively, and represent magnitude of size and density where 0 indicates no rosettes or no giant rosettes, 5 indicates large size, and 2 indicates high density. The limits within each parameter are as follows. For rosetting and giant rosetting size, 1 = 2 to 5 RBC/pRBC (small); 3 = 6 to 10 RBC/pRBC (medium), and 5 = ≥11 RBC/pRBC (large). For rosetting density (see Fig. 1), 1 = loose; 2 = tight. Since many of the samples contained rosettes or giant rosettes that fell between these groups, catagories 2 (2 to 10 RBC/pRBC; small-medium) and 4 (5 to 15 pRBC/RBC; medium-large) were added. Asterisks indicate a total size-density score of >7.

