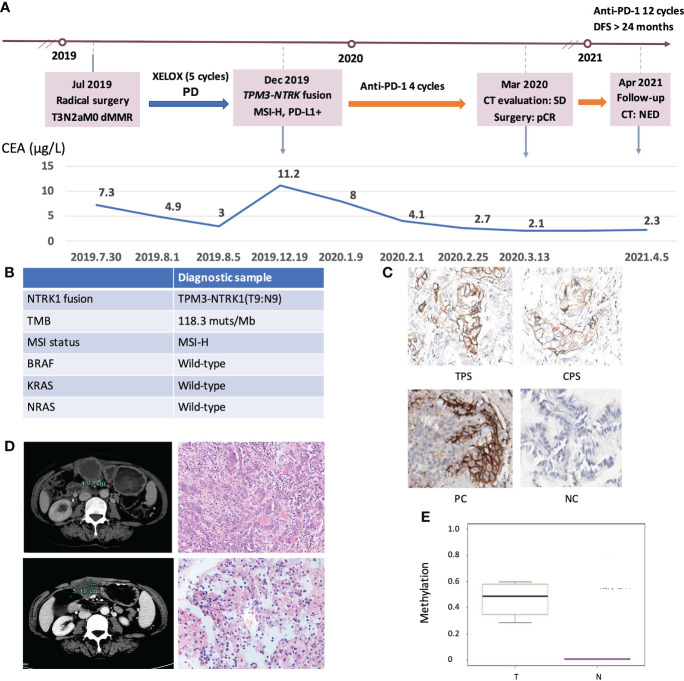
Figure 7.
Clinical response of an ICIs-treated NRKT fusion MSI-H CRC patient. (A) Diagram of the course of disease management, showing different treatment regimens prescribed. (B) The molecular diagnosis of this case. (C) IHC staining of PD-L1 expressions in tumor proportion score (TPS), combined positive score (CPS), positive control (PC), and negative control (NC). (D) CT evaluation and HE images of the patient at the first (upper) and second (lower) surgical timepoint. (E) Comparison of MLH1 methylation levels between NRKT fusion MSI-H tumor tissue and non-tumor tissue. T, tumor tissue; N, non-tumor tissue.

