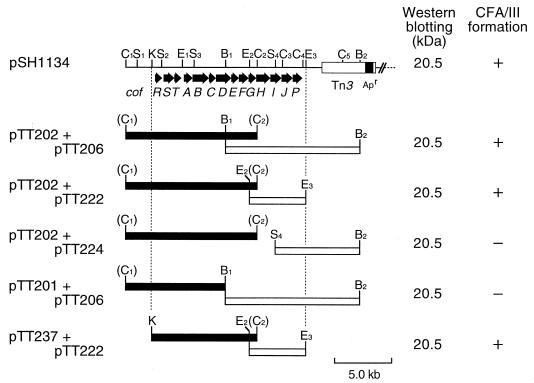
FIG. 1.
Restriction maps of pSH1134 and CFA/III clones and their expression. pSH1134, pTT202, and pTT206 were digested with the appropriate restriction endonucleases and the fragments (solid and open boxes) were cloned into pMW119 and pACYC184, respectively. The cloned genes were expressed under the control of their own promoter or promoter on the cloning vector. The proposed organization of the cof gene cluster is illustrated in the upper part of the figure. The values represent the molecular mass (in kilodaltons) on Western blot analysis with anti-CFA/III antiserum. The symbols (+ and −) on the right side show the results of CFA/III formation. + and − represent the formation and the nonformation of CFA/III, respectively. Restriction endonuclease sites: B, BamHI; C, ClaI; E, EcoRI; K, KpnI; and S, SalI.

